Twelve terrain plates

Use your browser’s Print command. Choose portrait A4 or US Letter, default margins, 100% scale and no browser headers/footers. Each SVG is vector artwork; the printed scale bar remains valid when the page is resized. Physical print quality has not been tested.

Return to complete descriptions
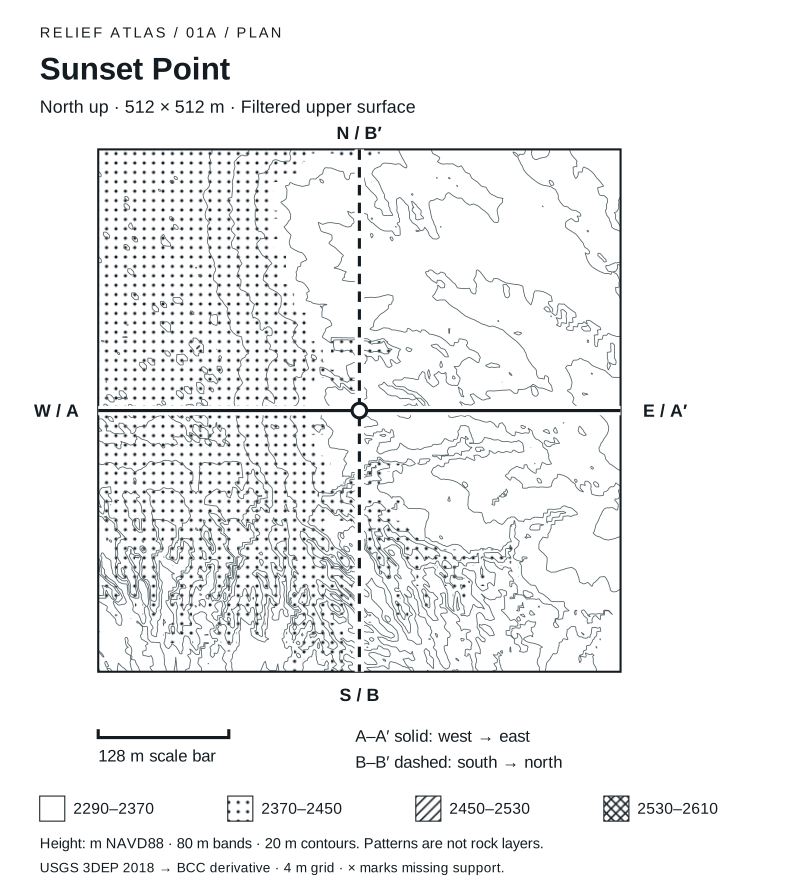
Sunset Point plan. Sunset Point. North is at the top, east at the right. A square 512 metres wide. Four patterns mark equal 80 metre elevation bands from 2290 to 2610 metres NAVD88. Thin lines connect interpolated equal heights at 20 metre intervals. The band positions differ between sectors; read their numbers. Solid A–A prime runs west to east across the center. Dashed B–B prime runs south to north through the center. The grid contains 0 unsupported nodes, shown as crosses in affected cells. This is filtered upper surface, derived from 2018 airborne lidar. Patterns do not identify rock layers or ground access. In this grid, supported heights span 2293 to 2458 m. Divide the plan into nine equal regions: the highest regional sample average is in the west-center (2428 m), and the lowest in the east-center (2319 m). Region means omit unsupported nodes; they describe surface relief, not viewpoints or walkable ground.
Sunset Point · North-up relief plan
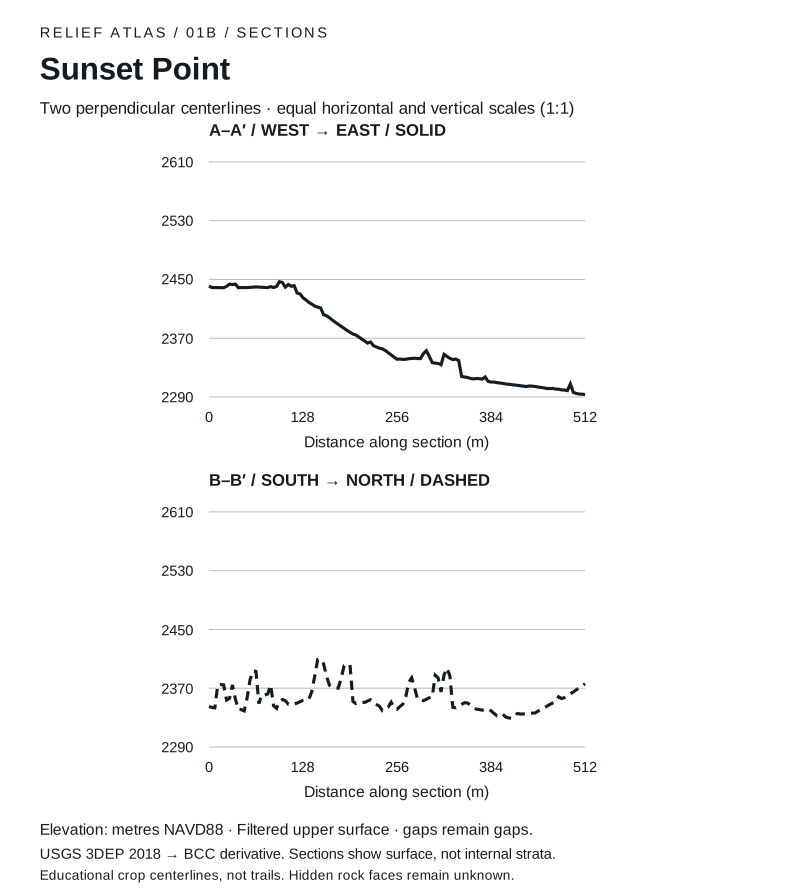
Sunset Point sections. West to east through the crop center. 0 m: 2441 m elevation; 128 m: 2425 m elevation; 256 m: 2341 m elevation; 384 m: 2310 m elevation; 512 m: 2293 m elevation. Lowest supported sample: 2293 m at 512 m. Highest: 2447 m at 96 m. South to north through the crop center. 0 m: 2345 m elevation; 128 m: 2353 m elevation; 256 m: 2341 m elevation; 384 m: 2339 m elevation; 512 m: 2376 m elevation. Lowest supported sample: 2329 m at 412 m. Highest: 2409 m at 152 m.
Sunset Point · Paired surface sections
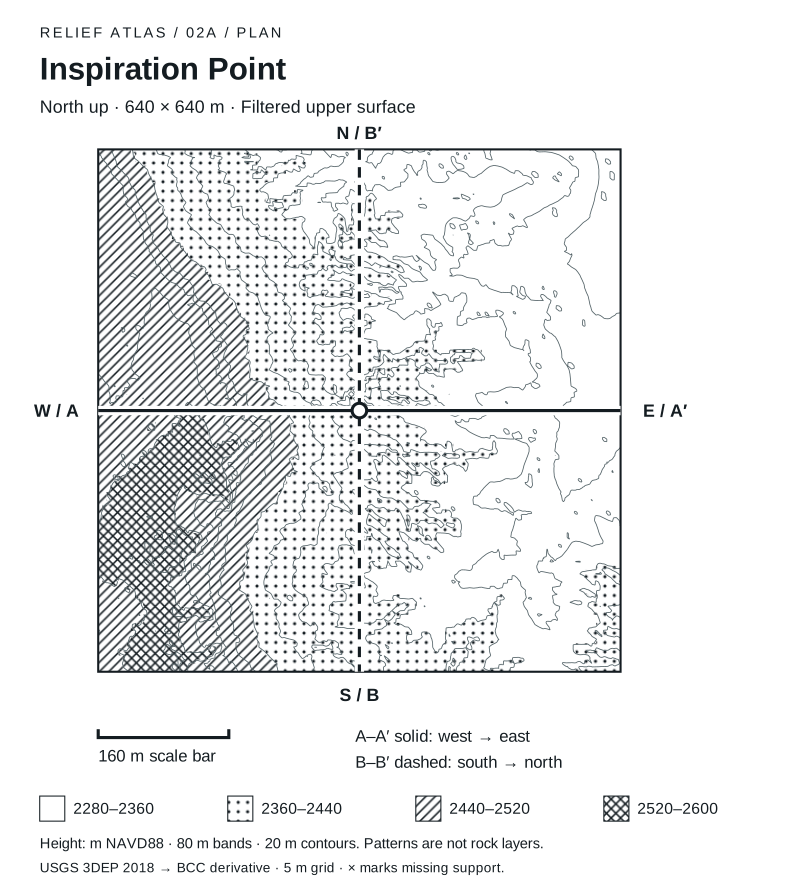
Inspiration Point plan. Inspiration Point. North is at the top, east at the right. A square 640 metres wide. Four patterns mark equal 80 metre elevation bands from 2280 to 2600 metres NAVD88. Thin lines connect interpolated equal heights at 20 metre intervals. The band positions differ between sectors; read their numbers. Solid A–A prime runs west to east across the center. Dashed B–B prime runs south to north through the center. The grid contains 0 unsupported nodes, shown as crosses in affected cells. This is filtered upper surface, derived from 2018 airborne lidar. Patterns do not identify rock layers or ground access. In this grid, supported heights span 2285 to 2552 m. Divide the plan into nine equal regions: the highest regional sample average is in the west-center (2498 m), and the lowest in the northeast (2318 m). Region means omit unsupported nodes; they describe surface relief, not viewpoints or walkable ground.
Inspiration Point · North-up relief plan
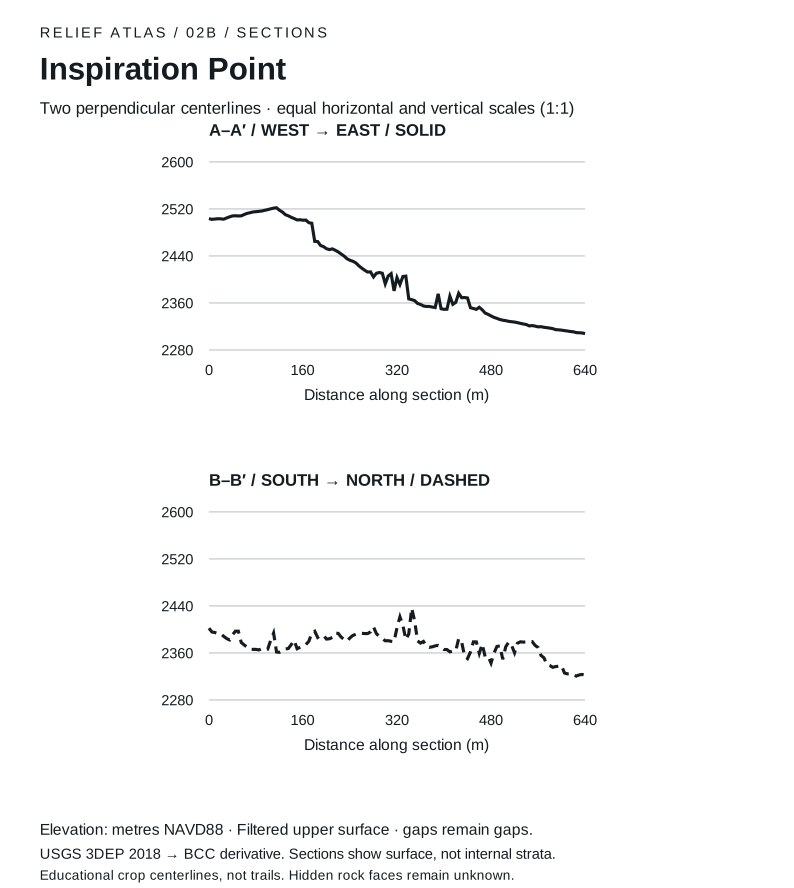
Inspiration Point sections. West to east through the crop center. 0 m: 2504 m elevation; 160 m: 2501 m elevation; 320 m: 2403 m elevation; 480 m: 2338 m elevation; 640 m: 2308 m elevation. Lowest supported sample: 2308 m at 640 m. Highest: 2522 m at 115 m. South to north through the crop center. 0 m: 2402 m elevation; 160 m: 2372 m elevation; 320 m: 2403 m elevation; 480 m: 2343 m elevation; 640 m: 2322 m elevation. Lowest supported sample: 2321 m at 625 m. Highest: 2436 m at 345 m.
Inspiration Point · Paired surface sections
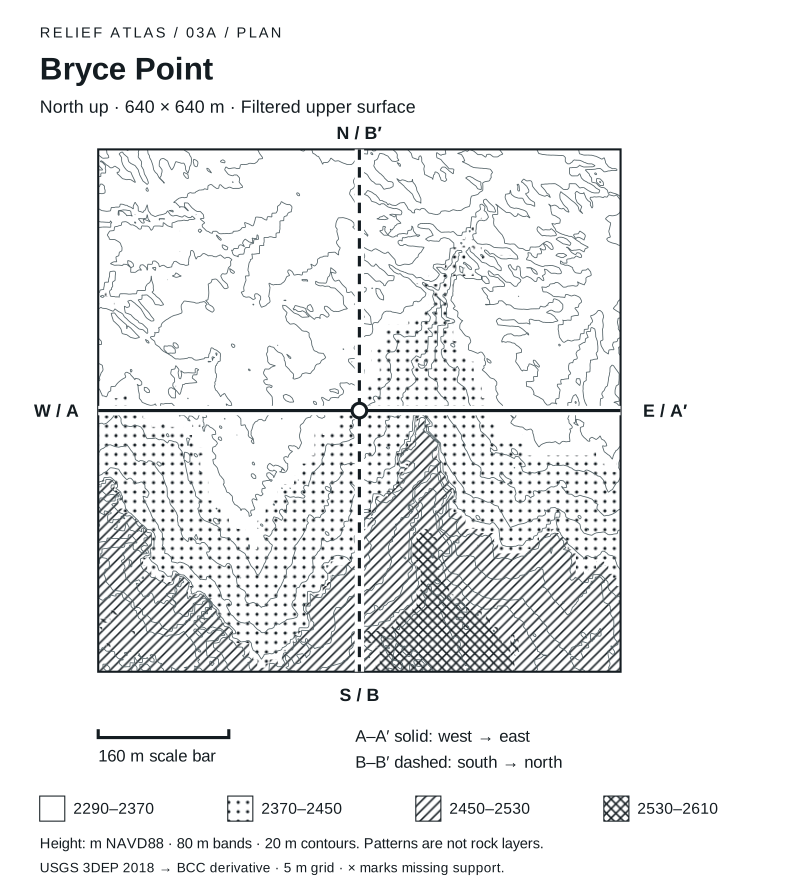
Bryce Point plan. Bryce Point. North is at the top, east at the right. A square 640 metres wide. Four patterns mark equal 80 metre elevation bands from 2290 to 2610 metres NAVD88. Thin lines connect interpolated equal heights at 20 metre intervals. The band positions differ between sectors; read their numbers. Solid A–A prime runs west to east across the center. Dashed B–B prime runs south to north through the center. The grid contains 0 unsupported nodes, shown as crosses in affected cells. This is filtered upper surface, derived from 2018 airborne lidar. Patterns do not identify rock layers or ground access. In this grid, supported heights span 2296 to 2554 m. Divide the plan into nine equal regions: the highest regional sample average is in the southeast (2477 m), and the lowest in the north-center (2330 m). Region means omit unsupported nodes; they describe surface relief, not viewpoints or walkable ground.
Bryce Point · North-up relief plan
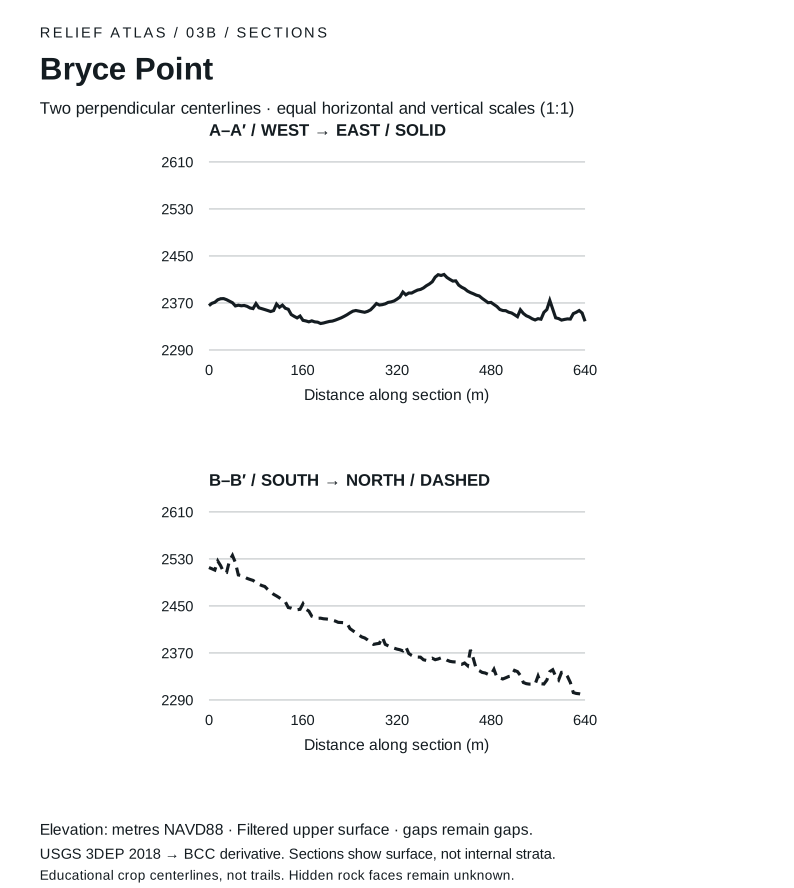
Bryce Point sections. West to east through the crop center. 0 m: 2365 m elevation; 160 m: 2340 m elevation; 320 m: 2377 m elevation; 480 m: 2371 m elevation; 640 m: 2339 m elevation. Lowest supported sample: 2335 m at 190 m. Highest: 2418 m at 400 m. South to north through the crop center. 0 m: 2515 m elevation; 160 m: 2454 m elevation; 320 m: 2377 m elevation; 480 m: 2333 m elevation; 640 m: 2298 m elevation. Lowest supported sample: 2298 m at 640 m. Highest: 2536 m at 40 m.
Bryce Point · Paired surface sections
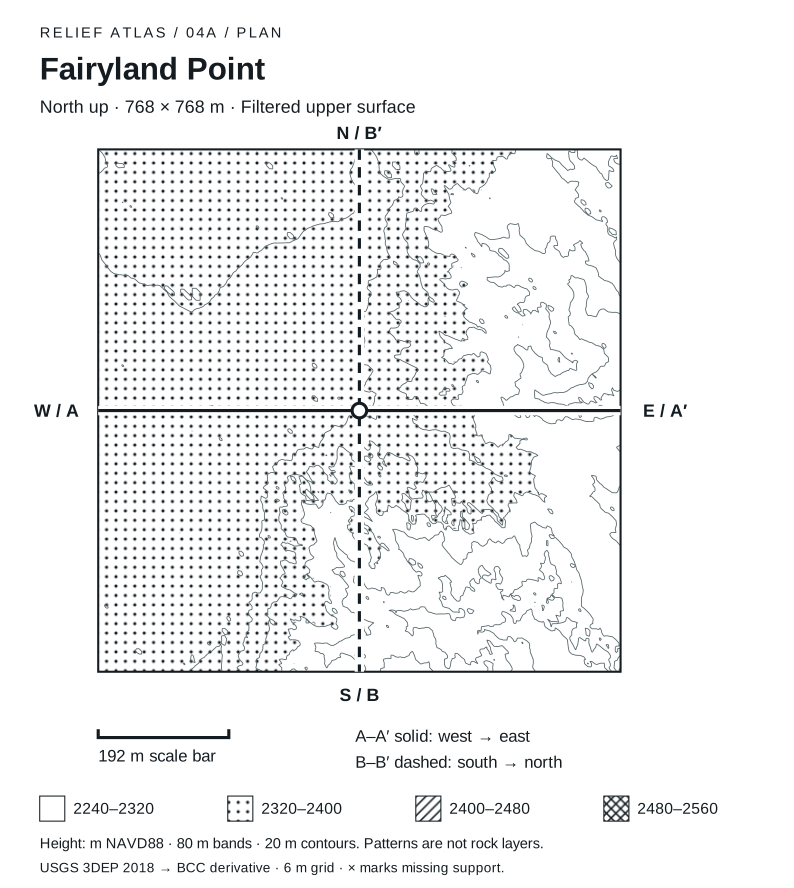
Fairyland Point plan. Fairyland Point. North is at the top, east at the right. A square 768 metres wide. Four patterns mark equal 80 metre elevation bands from 2240 to 2560 metres NAVD88. Thin lines connect interpolated equal heights at 20 metre intervals. The band positions differ between sectors; read their numbers. Solid A–A prime runs west to east across the center. Dashed B–B prime runs south to north through the center. The grid contains 0 unsupported nodes, shown as crosses in affected cells. This is filtered upper surface, derived from 2018 airborne lidar. Patterns do not identify rock layers or ground access. In this grid, supported heights span 2245 to 2394 m. Divide the plan into nine equal regions: the highest regional sample average is in the southwest (2369 m), and the lowest in the southeast (2289 m). Region means omit unsupported nodes; they describe surface relief, not viewpoints or walkable ground.
Fairyland Point · North-up relief plan
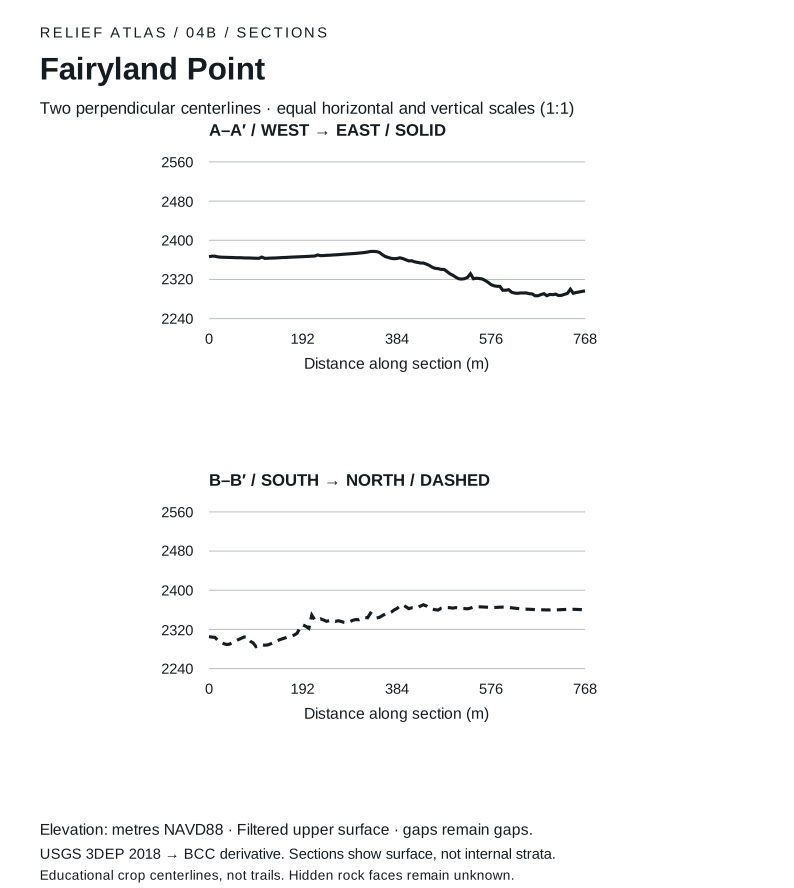
Fairyland Point sections. West to east through the crop center. 0 m: 2367 m elevation; 192 m: 2367 m elevation; 384 m: 2363 m elevation; 576 m: 2309 m elevation; 768 m: 2297 m elevation. Lowest supported sample: 2287 m at 666 m. Highest: 2377 m at 336 m. South to north through the crop center. 0 m: 2305 m elevation; 192 m: 2329 m elevation; 384 m: 2363 m elevation; 576 m: 2365 m elevation; 768 m: 2360 m elevation. Lowest supported sample: 2285 m at 96 m. Highest: 2370 m at 438 m.
Fairyland Point · Paired surface sections
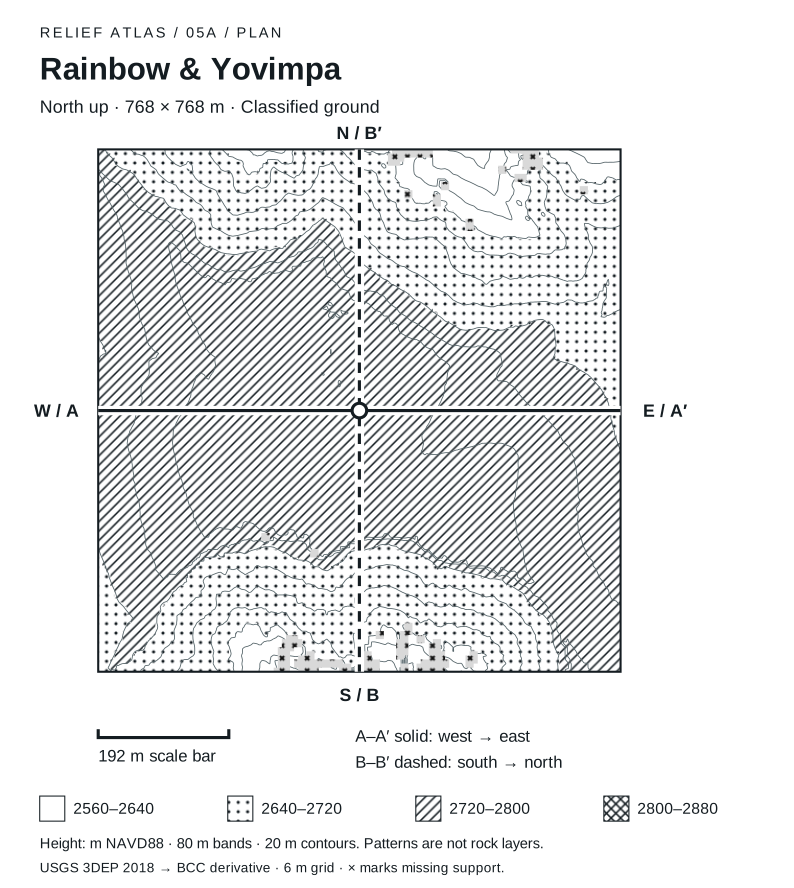
Rainbow & Yovimpa plan. Rainbow & Yovimpa. North is at the top, east at the right. A square 768 metres wide. Four patterns mark equal 80 metre elevation bands from 2560 to 2880 metres NAVD88. Thin lines connect interpolated equal heights at 20 metre intervals. The band positions differ between sectors; read their numbers. Solid A–A prime runs west to east across the center. Dashed B–B prime runs south to north through the center. The grid contains 138 unsupported nodes, shown as crosses in affected cells. This is classified ground, derived from 2018 airborne lidar. Patterns do not identify rock layers or ground access. In this grid, supported heights span 2567 to 2780 m. Divide the plan into nine equal regions: the highest regional sample average is in the center (2772 m), and the lowest in the northeast (2659 m). Region means omit unsupported nodes; they describe surface relief, not viewpoints or walkable ground.
Rainbow & Yovimpa · North-up relief plan
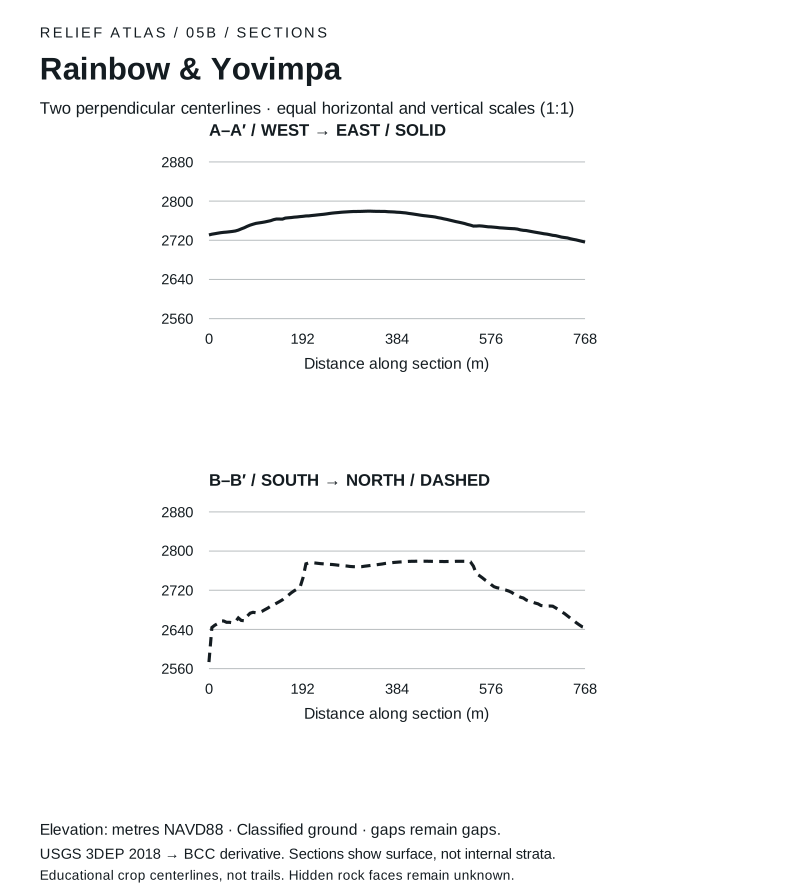
Rainbow & Yovimpa sections. West to east through the crop center. 0 m: 2731 m elevation; 192 m: 2769 m elevation; 384 m: 2777 m elevation; 576 m: 2747 m elevation; 768 m: 2716 m elevation. Lowest supported sample: 2716 m at 768 m. Highest: 2779 m at 330 m. South to north through the crop center. 0 m: 2573 m elevation; 192 m: 2745 m elevation; 384 m: 2777 m elevation; 576 m: 2732 m elevation; 768 m: 2644 m elevation. Lowest supported sample: 2573 m at 0 m. Highest: 2779 m at 528 m.
Rainbow & Yovimpa · Paired surface sections
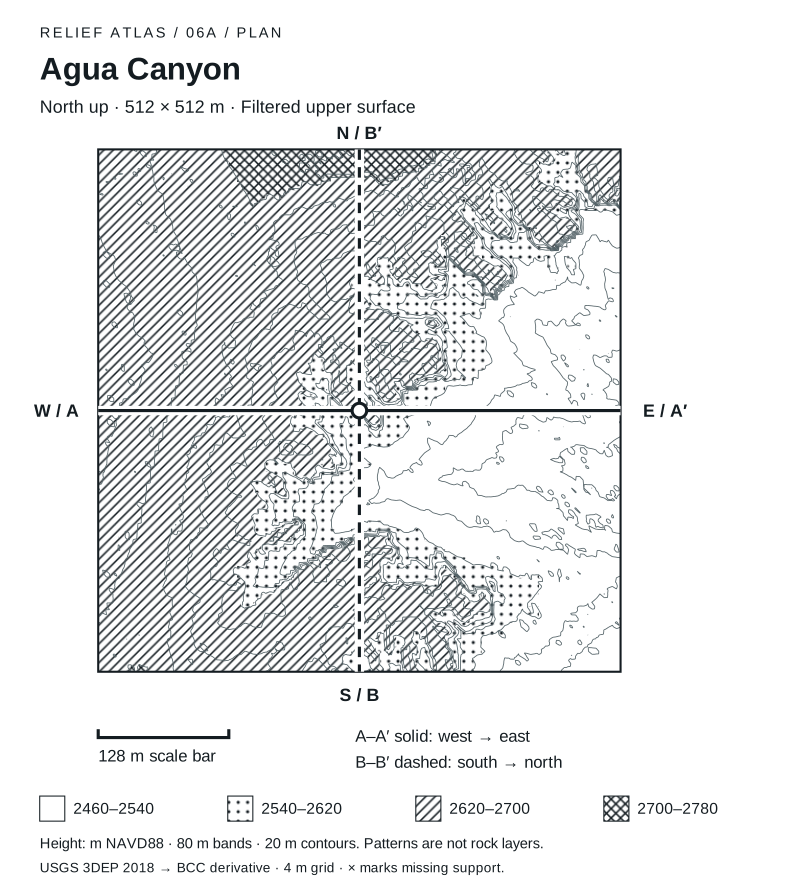
Agua Canyon plan. Agua Canyon. North is at the top, east at the right. A square 512 metres wide. Four patterns mark equal 80 metre elevation bands from 2460 to 2780 metres NAVD88. Thin lines connect interpolated equal heights at 20 metre intervals. The band positions differ between sectors; read their numbers. Solid A–A prime runs west to east across the center. Dashed B–B prime runs south to north through the center. The grid contains 0 unsupported nodes, shown as crosses in affected cells. This is filtered upper surface, derived from 2018 airborne lidar. Patterns do not identify rock layers or ground access. In this grid, supported heights span 2469 to 2731 m. Divide the plan into nine equal regions: the highest regional sample average is in the northwest (2681 m), and the lowest in the east-center (2503 m). Region means omit unsupported nodes; they describe surface relief, not viewpoints or walkable ground.
Agua Canyon · North-up relief plan
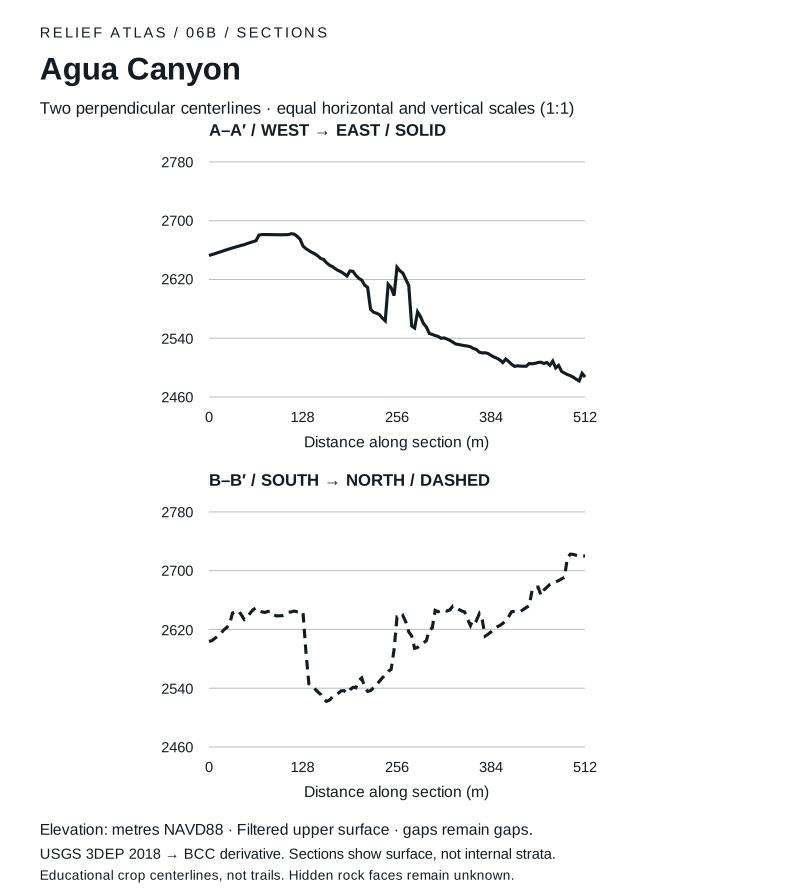
Agua Canyon sections. West to east through the crop center. 0 m: 2653 m elevation; 128 m: 2666 m elevation; 256 m: 2637 m elevation; 384 m: 2517 m elevation; 512 m: 2487 m elevation. Lowest supported sample: 2482 m at 504 m. Highest: 2682 m at 112 m. South to north through the crop center. 0 m: 2604 m elevation; 128 m: 2644 m elevation; 256 m: 2637 m elevation; 384 m: 2617 m elevation; 512 m: 2720 m elevation. Lowest supported sample: 2522 m at 160 m. Highest: 2723 m at 492 m.
Agua Canyon · Paired surface sections