06 / Teaching guide · Night sky · 40 minutes
The sky on a screen, the sky outside
Does ‘above the horizon’ mean ‘visible to me’?
Suggested ages 11–16. Ages and timings are editorial suggestions; adapt to your learners.
Prepare & connect
Open Night Sky Classroom or use the static plates. A pencil is enough; no telescope, location permission or night outing is required. Define altitude as angle above the horizon and direction as a compass bearing. This activity does not involve observing the Sun.
Optional local resource: Night Sky Classroom. JavaScript for the chart; the lesson plates and guide are a complete static activity. No location permission or telescope needed.
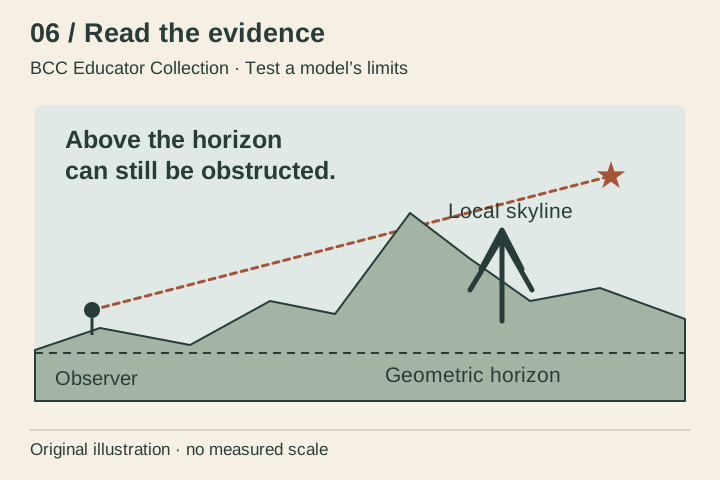
- 10 minRead the horizonCompare the straight horizon and the invented hill/tree skyline on the summary plate. Ask whether a point can be above one but hidden behind the other. The plate is a hypothetical example, not a Bryce skyline.
- 15 minChange one thingIn Night Sky Classroom, select the Summer preset, face North and select Polaris. Note the local time and listed position. Advance one hour and compare. Then keep the time fixed and turn the facing control; explain which action changes the observer’s view rather than the time.
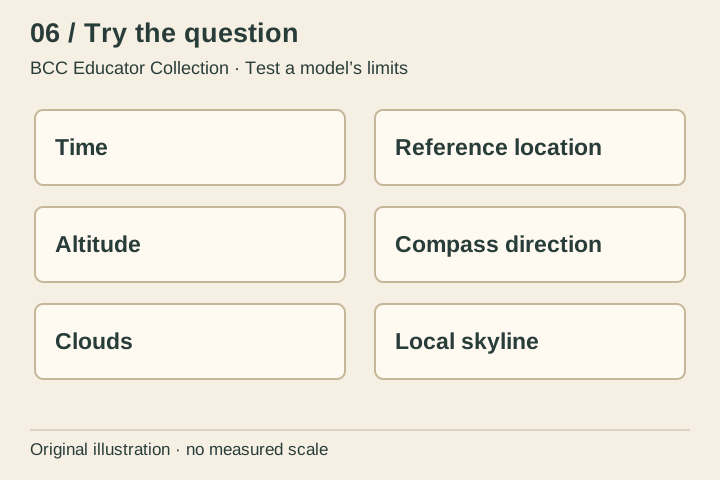
- 10 minSort model and worldUse the activity grid. Put time and reference location with model inputs; altitude and direction with outputs; clouds and trees with additional real-world information. If offline, reason from the categories instead of claiming to have run the chart.
- 5 minQualify a predictionRewrite ‘The chart shows it, so we will see it’ to identify the calculated result and at least two unknown observing conditions.
Time and reference location are inputs; altitude and compass direction are calculated outputs; clouds and a local skyline require other evidence. Fixed-time facing changes do not alter a star’s calculated sky coordinates. Browser or print evidence does not establish that a person could see the star outdoors.
Access: Use the chart’s scene list for numbers instead of the canvas. The printed categories and descriptions support the same task with no motion.
06 / Read the evidence · Learner sheet
The sky on a screen, the sky outside
Polaris lies near the north celestial pole, so its apparent motion is small compared with many other stars. A chart can calculate positions for a stated time and location. Seeing a star also depends on darkness, weather, the actual skyline and other observing conditions. The copied chart does not measure those conditions.
Look closely
- What could hide a star even when its calculated altitude is positive?
- Which action changes time, and which only changes the direction shown on the screen?
- Why is a large star symbol not a measurement of the star’s physical diameter?
Evidence limit: Conceptual sky plate, not a star chart. The linked calculated sky is not an observing forecast, real skyline, current weather report or field result.
Reading behind the lesson
- NASA / JPL-Caltech · What is the North Star and how do you find it? · 2024-11-06 (published 2021-07-28).
- National Park Service · Bryce Canyon · Night Skies · 2026-07-11.
- Copied integrated BCC experiences and source registers · 2026-10-02 snapshot.
06 / Try the question · Learner sheet
Test a model’s limits
Sort the six labelled items into input, calculated output or information still needed. Then write a conditional observing statement. The diagram’s star and skyline have no measured direction, angular scale or date; use them only to explain the distinction.
Take it further: Compare the chart’s geometric horizon with an imagined taller skyline. Which stars might become obstructed without any change to the astronomy calculation?
Success looks like: State a model result without making a weather or visibility claim.
All lessons and plates are included in this local copy. Linked experiences are optional. No learner names, responses or locations are collected by this collection.
Save summary plate (SVG) · Save activity plate (SVG)