04 / Teaching guide · Maps & data · 45 minutes
One trail, two kinds of number
What should we do when a mapped profile and a published total disagree?
Suggested ages 11–16. Ages and timings are editorial suggestions; adapt to your learners.
Prepare & connect
Provide a calculator, pencil and the two plates. Explain horizontal route distance and elevation in metres. The numbers are a dated source comparison, not an outing plan. Review the linked methods; learners do not need to open the optional 3D view.
Optional local resource: Queen’s Garden trail study. JavaScript for the linked map/profile; the two printed plots work independently. 3D is optional and outside this lesson.
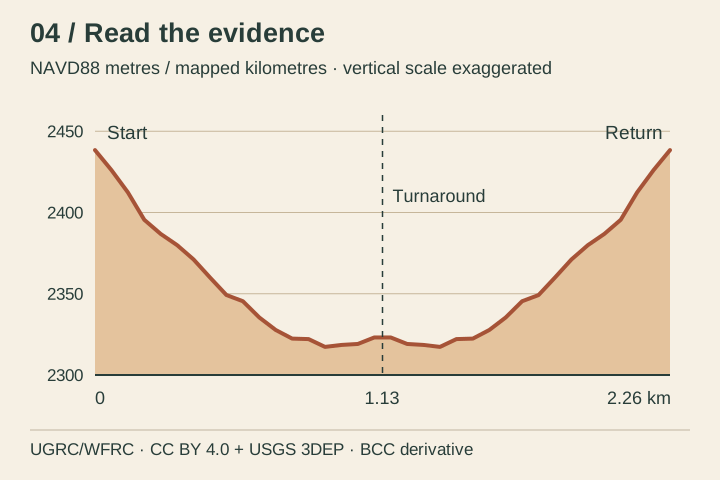
- 10 minRead the axesFind the start, turnaround and return on the summary profile. Describe where the return rises. Compare the horizontal and vertical units before judging the visual steepness of the line.
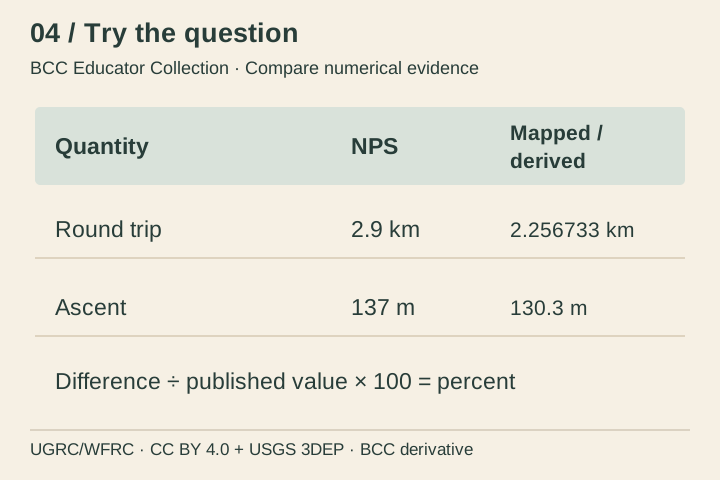
- 15 minKeep two columnsRead NPS’s 2.9 km round trip and the copied mapped calculation of 2256.733 m. Convert the latter to kilometres. Preserve their source labels and calculate how far apart they are.
- 15 minInvestigate a mismatchUse the activity table and methods. Discuss possible effects of different endpoints, simplified bends, sampling and rounding. Separate plausible explanations from a cause that the available evidence actually demonstrates.
- 5 minWrite a source noteWrite two sentences that report the mismatch and name a next check. Do not stretch the line, relabel the numbers as GPS measurements or choose the smaller figure for travel planning.
2.9 − 2.256733 = 0.643267 km, about 0.64 km or 22.2% of the published distance. 137 − 130.3 = 6.7 m. The differences are not measured errors or uncertainty bounds. The start and end share a location; the turnaround need not be the lowest point.
Access: The source figures are written in the activity table and this text. Learners can compare numbers without using the plot or dragging a slider.
04 / Read the evidence · Learner sheet
One trail, two kinds of number
The NPS page lists 2.9 km and 137 m of climbing for Queen’s Garden. The retained mapped route calculates 2.256733 km and a smoothed ascent of 130.3 m. Its profile uses mapped vertices and a sampled elevation model. These values describe different evidence and methods; neither comparison proves the route’s current condition.
Look closely
- Why is the end of an out-and-back at the same elevation as its start?
- Does the profile’s lowest point have to be exactly at the turnaround?
- Which difference can you calculate, and which cause remains unknown?
Evidence limit: Historical mapped route and DEM-derived profile, not a walking-tread survey, live route status, effort prediction or accessibility assessment.
Reading behind the lesson
- National Park Service · Queen’s Garden Trail · 2026-08-15.
- Integrated Queen’s Garden profile and methods · 2026-10-02 copied integration.
- Copied integrated BCC experiences and source registers · 2026-10-02 snapshot.
- Derived profile: UGRC/WFRC mapping, CC BY 4.0; USGS 3DEP elevation (public domain). BCC assembled and sampled the route; this plate resamples the retained overview.
04 / Try the question · Learner sheet
Compare numerical evidence
Compute published minus mapped distance and express the difference as a percentage of the published value. Round the reported answers sensibly. Compare published ascent with smoothed ascent, then explain why subtraction alone cannot establish which method is closer to current walking effort.
Take it further: The retained calculation also has raw ascent 140.5 m and coarser-sample ascent 126.4 m. Discuss why processing choices change a sum of small rises without turning this range into a confidence interval.
Success looks like: Distinguish a mapped estimate, a published figure and a field measurement.
All lessons and plates are included in this local copy. Linked experiences are optional. No learner names, responses or locations are collected by this collection.
Save summary plate (SVG) · Save activity plate (SVG)