Geologic scale clock / reading edition
Every scale.At your pace. Six studies and twelve source-qualified comparisons, with complete labels and local vector diagrams. This edition works without JavaScript.
Open the interactive clock ↗ 01 · Earth in a day / 02 · Reading the rock / 03 · Unequal chapters / 04 · The recent edge / 05 · A date with room / 06 · Rock & shape
01 / Earth in a day
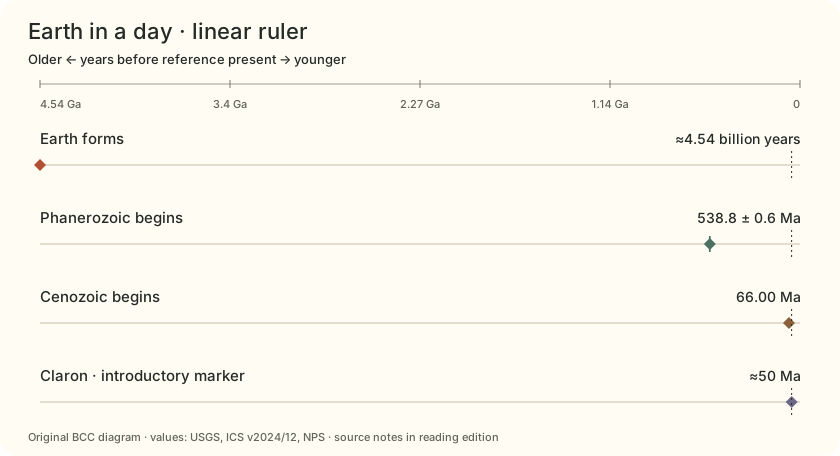
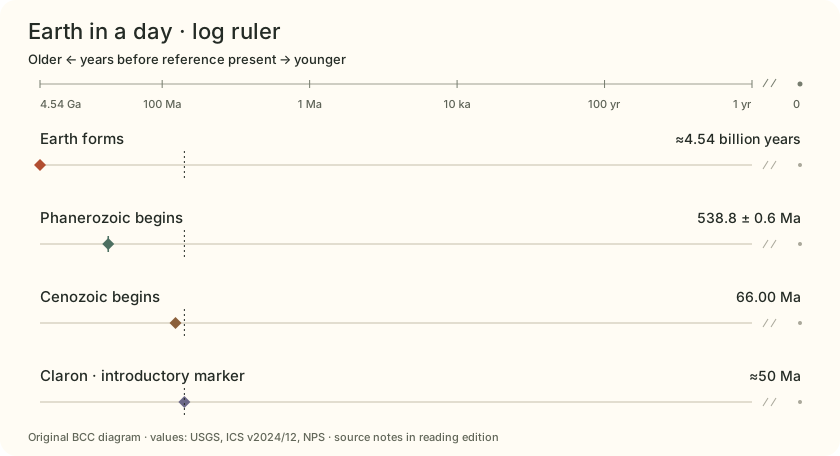
A whole planet. A small slice. Compress Earth’s age into one sweep of the dial. The Claron’s introductory marker lies very close to the present. Change to a log ruler to spread out the younger ages.
On a linear Earth clock, the last 50 million years occupy about 1.1% of the sweep.
Earth in a day: full record values and source qualifications Record Reference value Meaning and source Earth forms ≈4.54 billion years Rounded reference estimate; no numerical error band is inferred here.USGS
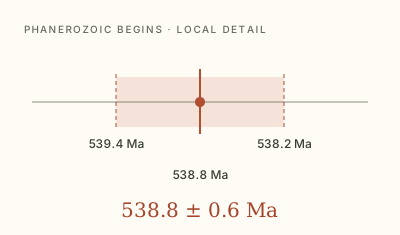
Phanerozoic begins 538.8 ± 0.6 Ma The ± value is the chart’s reported numerical uncertainty, not a period duration.ICS
Cenozoic begins 66.00 Ma No ± value is supplied for this entry; that does not mean zero uncertainty.ICS
Claron · introductory marker ≈50 Ma A rounded teaching marker from NPS, not the age of every bed or a particular hoodoo.NPS · hoodoos
What changes when equal distances mean equal ratios?
01 / Earth in a day
≈91×
Earth’s history / Claron marker About 91 Claron-marker look-back spans fit into Earth’s age.
How to read this comparison 4.54 billion ÷ 50 million years
Both are rounded age estimates. A 24-hour Earth analogy puts the marker about 16 minutes before the end.
USGS / NPS · hoodoos
01 / Earth in a day
≈8.4×
Earth’s history / Phanerozoic The Phanerozoic occupies about 12% of Earth’s age.
How to read this comparison 4.54 billion ÷ 538.8 million years
A ratio of numerical reference ages, rounded for scale reading.
USGS / ICS
02 / Reading the rock
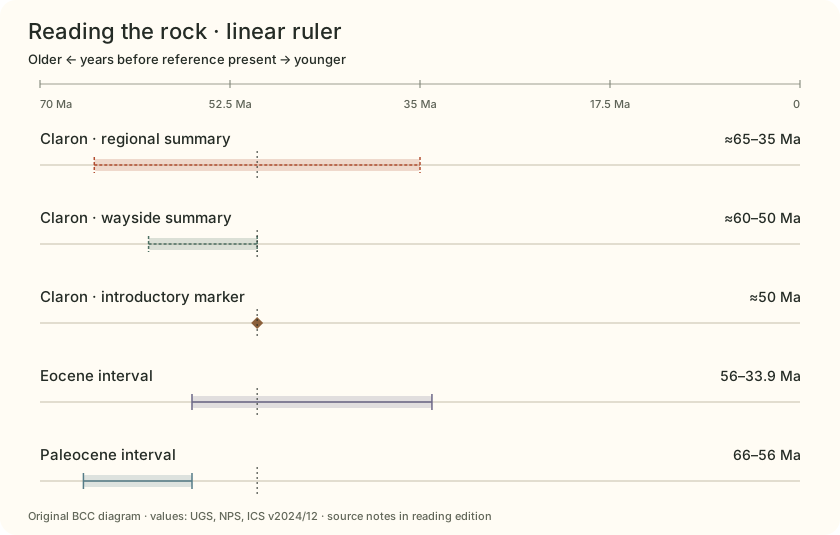
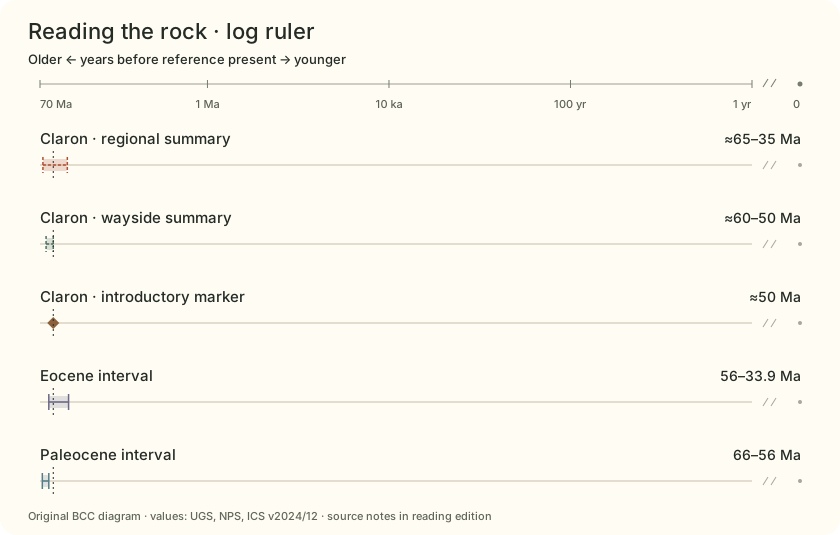
Keep the source with the age. A regional formation summary and a wayside introduction can use different windows. Compare them without turning either window into an error bar.
The Claron windows describe source scope; the Eocene and Paleocene bars describe time intervals.
Reading the rock: full record values and source qualifications Record Reference value Meaning and source Claron · regional summary ≈65–35 Ma UGS regional age envelope. It does not mean uninterrupted deposition at one site.UGS
Claron · wayside summary ≈60–50 Ma NPS wayside summary. Its narrower window is kept separate from the regional envelope.NPS · wayside
Claron · introductory marker ≈50 Ma A rounded teaching marker from NPS, not the age of every bed or a particular hoodoo.NPS · hoodoos
Eocene interval 56–33.9 Ma 22.1 million years by subtraction of the pinned numerical boundaries.ICS
Paleocene interval 66–56 Ma An interval between two chart boundaries; the shaded width is elapsed time.ICS
Is this band a span of time, a broad summary, or numerical uncertainty?
02 / Reading the rock
≈3×
Regional window / wayside window The broad UGS window spans three times the NPS wayside window.
How to read this comparison (65 − 35) ÷ (60 − 50) million years
Different source summaries; neither width is a dating error or evidence of continuous local deposition.
UGS / NPS · wayside
02 / Reading the rock
≈2.2×
Eocene / Paleocene duration The Eocene interval is a little over twice as long as the Paleocene.
How to read this comparison (56 − 33.9) ÷ (66 − 56) million years
Calculated from pinned chart boundaries; formation names and epoch names are different classifications.
ICS
03 / Unequal chapters
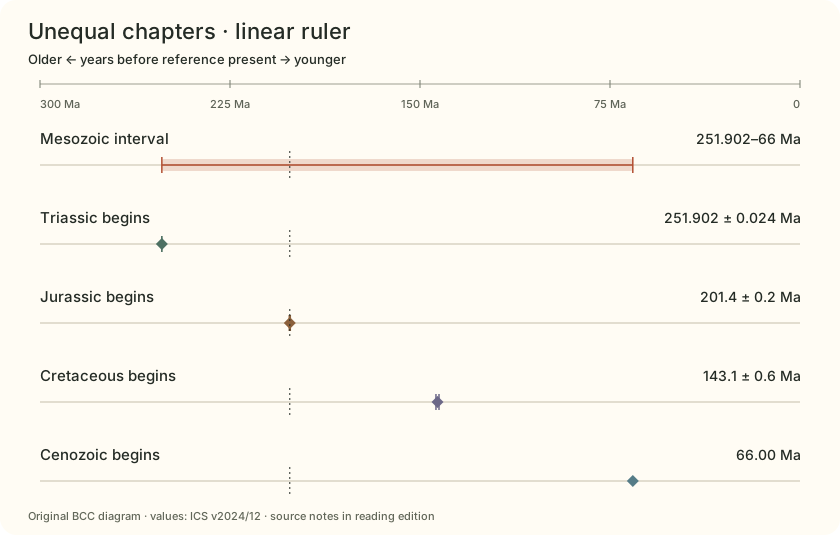
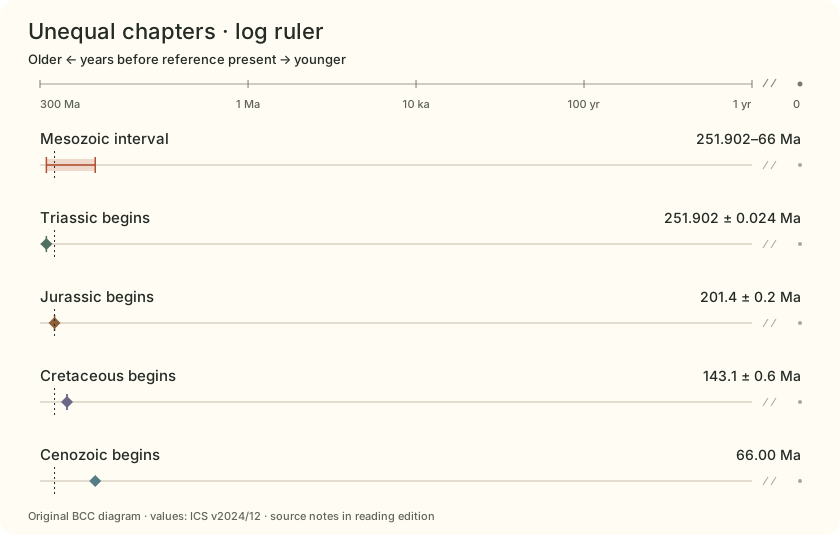
A period is not a fixed-size box. Place the Mesozoic boundaries on an actual time ruler. Period names divide history; they do not promise equal durations.
Linear spacing compares differences in years. Log spacing compares ratios of positive ages.
Unequal chapters: full record values and source qualifications Record Reference value Meaning and source Mesozoic interval 251.902–66 Ma A calculated interval; displayed endpoints do not confer exact duration.ICS
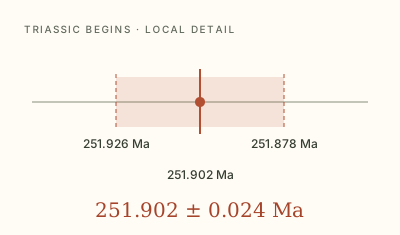
Triassic begins 251.902 ± 0.024 Ma A numerical estimate of a boundary; the geological boundary is defined separately.ICS
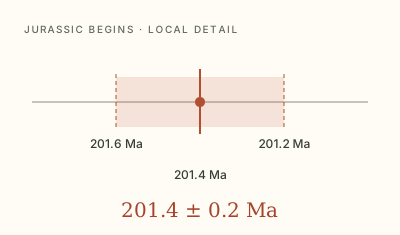
Jurassic begins 201.4 ± 0.2 Ma Printed precision is retained in the label. The band does not represent a probability density.ICS
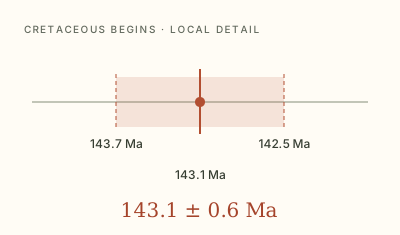
Cretaceous begins 143.1 ± 0.6 Ma Pinned to ICS v2024/12; numerical ages can be revised.ICS
Cenozoic begins 66.00 Ma No ± value is supplied for this entry; that does not mean zero uncertainty.ICS
Which gap is larger on each ruler, and why?
03 / Unequal chapters
≈2.8×
Mesozoic / Cenozoic span The Mesozoic spans about 2.8 times the Cenozoic to reference present.
How to read this comparison (251.902 − 66) ÷ 66 million years
Derived scale comparison, not an exact duration measurement.
ICS
03 / Unequal chapters
≈1.2×
Jurassic / Triassic duration These two periods differ in duration even when a chart gives them equal space.
How to read this comparison (201.4 − 143.1) ÷ (251.902 − 201.4)
Period boxes in conventional charts are not necessarily drawn to a time scale.
ICS
04 / The recent edge
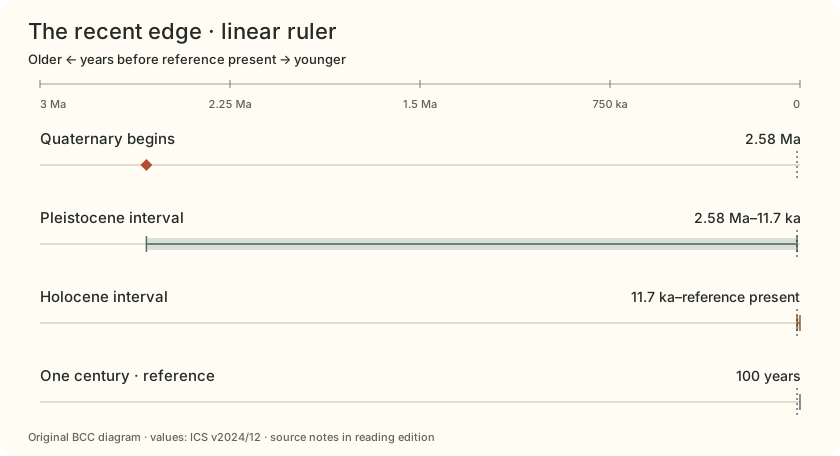
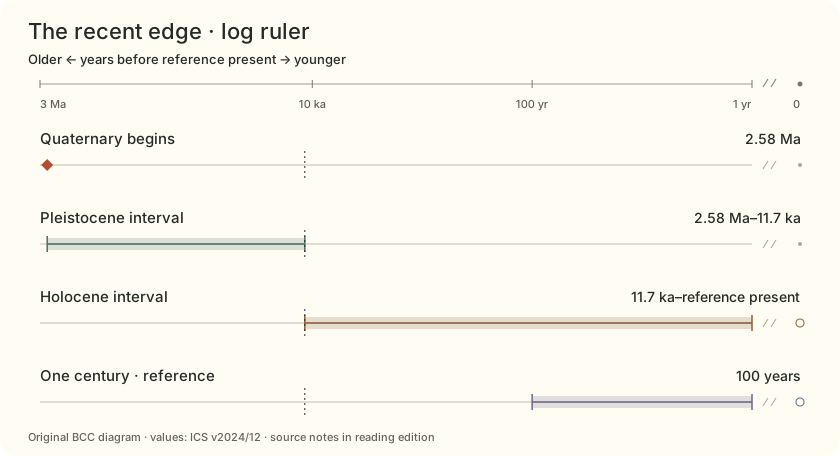
Zoom into the youngest sliver. A few million years still dwarf a century. The log view makes very short reference spans legible without changing their values.
The Holocene reference is 11,700 years before 2000 CE. “Present” here is a reference zero, not a live calendar.
The recent edge: full record values and source qualifications Record Reference value Meaning and source Quaternary begins 2.58 Ma Numerical age from the pinned ICS chart.ICS
Pleistocene interval 2.58 Ma–11.7 ka Rounded chart coordinates; this is not an exact calendar subtraction.ICS
Holocene interval 11.7 ka–reference present The Holocene boundary is referenced to 2000 CE (b2k). This scale does not add years as the calendar advances.ICS / ICS · datum
One century · reference 100 years An exact unit benchmark, not a measured lifespan, local event or erosion rate.
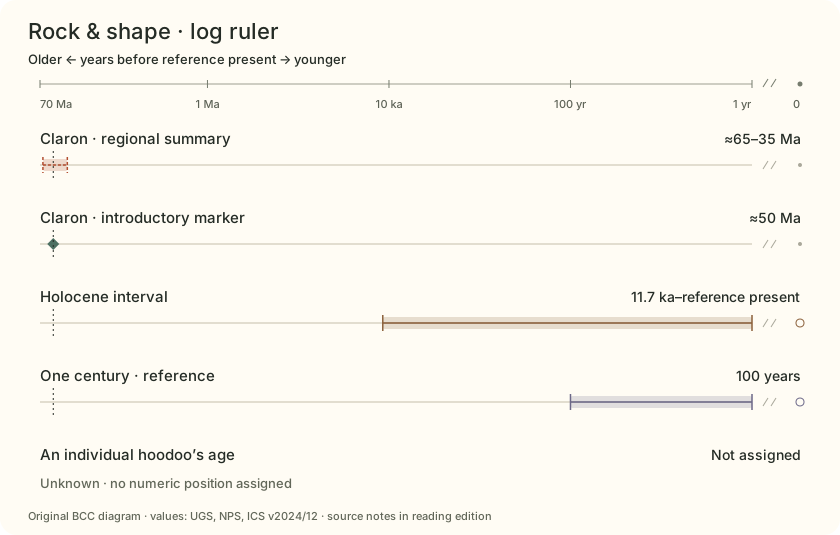
Where does zero go when the ruler uses logarithms?
04 / The recent edge
≈220×
Quaternary / Holocene look-back The Holocene boundary sits within the youngest half-percent of the Quaternary look-back span.
How to read this comparison 2,580,000 ÷ 11,700 years
Uses rounded source coordinates; the Holocene datum is 2000 CE, not the current year.
ICS / ICS · datum
04 / The recent edge
≈117×
Holocene reference / a century 11,700 years is 117 blocks of 100 years.
How to read this comparison 11,700 ÷ 100 years
Unit arithmetic using the published b2k reference age; no local human-history claim is made.
ICS / ICS · datum
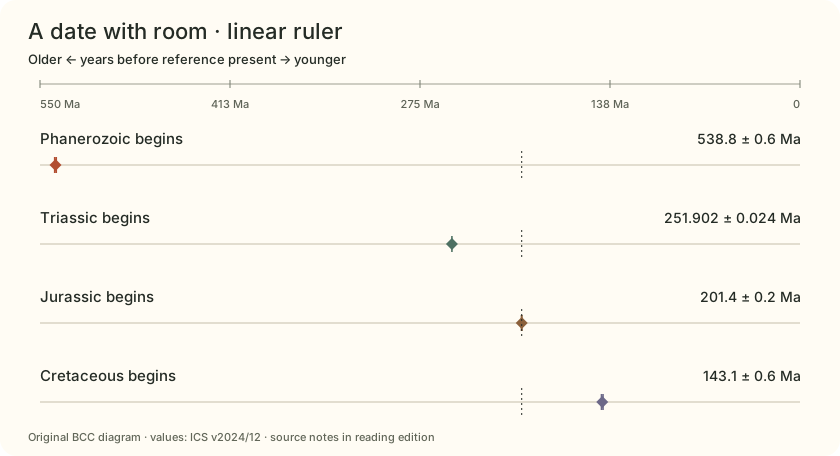
05 / A date with room
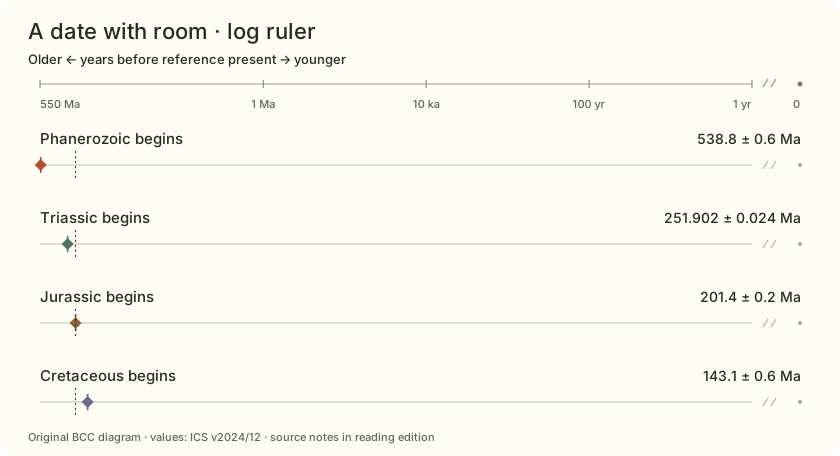
Give a numerical date its room. The bands around these boundaries show the ± values printed by ICS. Open the detail lens to see a band that is too narrow on the broad view.
Reported ± values are not durations. This kit does not assign them a probability distribution or confidence level.
A date with room: full record values and source qualifications Record Reference value Meaning and source Phanerozoic begins 538.8 ± 0.6 Ma The ± value is the chart’s reported numerical uncertainty, not a period duration.ICS
Triassic begins 251.902 ± 0.024 Ma A numerical estimate of a boundary; the geological boundary is defined separately.ICS
Jurassic begins 201.4 ± 0.2 Ma Printed precision is retained in the label. The band does not represent a probability density.ICS
Cretaceous begins 143.1 ± 0.6 Ma Pinned to ICS v2024/12; numerical ages can be revised.ICS
Can you see the error band at this scale, or only its point symbol?
05 / A date with room
≈3×
Cretaceous ± / Jurassic ± The printed Cretaceous numerical uncertainty is three times the Jurassic value.
How to read this comparison 0.6 ÷ 0.2 million years
Compares reported ± values, not the durations of the periods or a common confidence level.
ICS
05 / A date with room
≈25×
Phanerozoic ± / Triassic ± The printed ± values differ by a factor of 25.
How to read this comparison 0.6 ÷ 0.024 million years
A wider numerical band does not mean the boundary itself lasted longer.
ICS
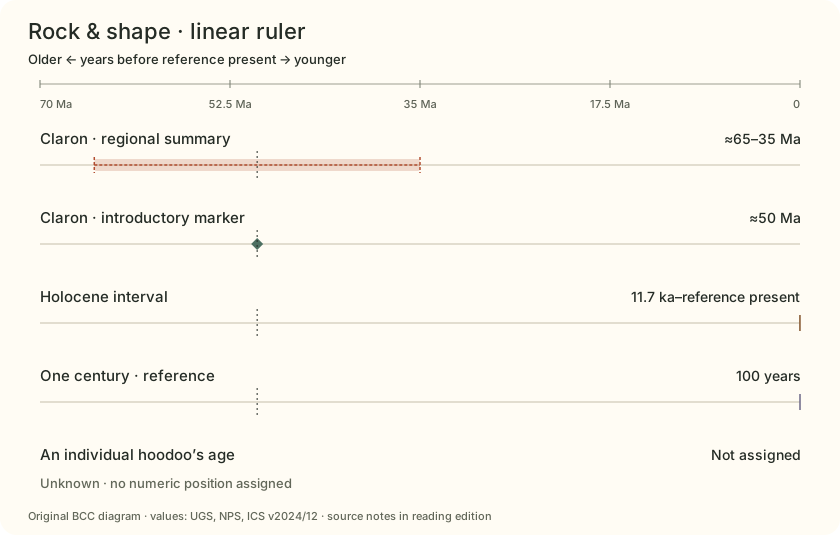
06 / Rock & shape
Old rock. A later shape. A formation age belongs to the rock record. A column emerges through later weathering and erosion. None of the selected references gives an individual hoodoo a birthday.
An unknown landform age stays unplotted. It is never silently placed at zero or inferred from a regional erosion rate.
Rock & shape: full record values and source qualifications Record Reference value Meaning and source Claron · regional summary ≈65–35 Ma UGS regional age envelope. It does not mean uninterrupted deposition at one site.UGS
Claron · introductory marker ≈50 Ma A rounded teaching marker from NPS, not the age of every bed or a particular hoodoo.NPS · hoodoos
Holocene interval 11.7 ka–reference present The Holocene boundary is referenced to 2000 CE (b2k). This scale does not add years as the calendar advances.ICS / ICS · datum
One century · reference 100 years An exact unit benchmark, not a measured lifespan, local event or erosion rate.
An individual hoodoo’s age Not assigned The selected sources do not date a particular column. Unknown is not zero.NPS · atlas
Which question are you asking: when did the rock form, or when did this shape emerge?
06 / Rock & shape
≈500,000×
Claron marker / one century A 50-million-year look-back spans about 500,000 centuries.
How to read this comparison 50,000,000 ÷ 100 years
The century is only a unit benchmark. This does not date a hoodoo or forecast its survival.
NPS · hoodoos / NPS · atlas
06 / Rock & shape
≈4,300×
Claron marker / Holocene reference The rounded Claron marker is about 4,300 Holocene reference spans ago.
How to read this comparison 50,000,000 ÷ 11,700 years
An age-scale comparison only; rock and landform histories remain separate.
NPS · hoodoos / ICS / NPS · atlas
Four numerical uncertainty details Each diagram uses its own local linear zoom. Compare the printed ± values rather than the apparent widths in separate diagrams.
How the ruler works
Change the spacing. A linear ruler places an age at 1 − age / window. A logarithmic ruler uses 1 − log₁₀(age) / log₁₀(window), with a positive lower limit of one year. Older ages sit on the left.
Zero has no logarithm. The log ruler leaves out 0–1 year and shows reference zero separately across a break. Intervals reaching the present end at that separate marker; unknown ages receive no marker.
The dial uses the same transform across a 300° sweep. The optional 24-hour readout is a linear analogy for the selected window. There is no geological-rate simulation.
Age and duration Ma means millions of years before a reference present. A duration is the difference between two ages, expressed here as years or Myr. Ratios use unrounded source numbers; outputs usually show two significant digits. Reported uncertainty A ± band shows a source’s numerical uncertainty around a boundary estimate. It does not represent elapsed deposition time, a probability density, or a confidence level assigned by this kit. Dates are reference coordinates The Holocene boundary uses 11,700 years before 2000 CE (b2k). The broad chart is not a live calendar. No date or lifetime is assigned to a real hoodoo. How small can a band get? Band geometry retains its calculated width, even below a screen pixel. Fixed-size point symbols aid selection; the uncertainty lens shows a local linear detail. Symbols are not magnified error bars. Keep the source with the number
Reading & references Primary references checked October 2, 2026. Time-scale values are pinned to ICS v2024/12 so this comparison stays reproducible.
U.S. Geological Survey Powell Expedition—Geologic Time. Then and Now. ↗ Earth age: approximately 4.54 billion years.
Published or updated 2019-08-02 · checked 2026-10-02
Factual reference only; no source media or prose reproduced.
International Commission on Stratigraphy International Chronostratigraphic Chart, v2024/12 ↗ Pinned numerical boundaries and their printed ± values.
Published or updated 2024-12 · checked 2026-10-02
Factual numerical extraction credited to ICS (Cohen, Finney, Gibbard & Fan, 2013; updated 2024). No chart artwork or colors copied. Newer versions exist; this edition is deliberately pinned.
International Commission on Stratigraphy Formal subdivision of the Holocene Series/Epoch ↗ Holocene/Greenlandian boundary: 11,700 yr b2k, meaning before 2000 CE.
Published or updated 2018-06-19 · checked 2026-10-02
Factual reference only; no source media or prose reproduced.
Utah Geological Survey Mapping Geologic Hazards in and Near Bryce Canyon National Park ↗ Regional Claron age summary: about 65–35 million years; ongoing erosion and mass wasting.
Published or updated 2023-05-01 · checked 2026-10-02
Factual reference only. Tyler Knudsen, Survey Notes 55(2). No photographs, maps or source prose reproduced.
National Park Service Deciphering Nature’s Palette wayside ↗ Wayside Claron age summary: 50–60 million years.
Published or updated 2024-01-08 · checked 2026-10-02
Factual reference only; no wayside image or source prose reproduced.
National Park Service Hoodoos ↗ Introductory lake/floodplain marker near 50 million years; deposition, uplift and later shaping are separate processes.
Published or updated 2021-09-04 · checked 2026-10-02
Factual reference only. No third-party Lake Claron map or NPS photograph reproduced.
National Park Service Geodiversity Atlas—Bryce Canyon National Park, Utah ↗ Hoodoos are erosional forms in the Claron Formation, shaped along fractures. This source does not assign individual hoodoo ages.
Published or updated 2024-06-17 · checked 2026-10-02
Factual reference only; no source media or prose reproduced.