The rocks came first. The hoodoos came much later.
Follow six chapters from sediment to the landscape we see today. This is a sequence of ideas, not a clock: equal steps cover unequal and sometimes overlapping spans of time.
Stream → changing lake → floodplain
Illustration Interpreted lake and floodplain setting. Shorelines, relief, plants, and bed geometry are invented for explanation, not a reconstruction of a particular ancient view.IllustrationSchematic section. Different environments leave different deposits. The repeated layers represent changing conditions, not annual layers.
Around 50 million years ago
An introductory age marker from NPS; not the beginning or end of every Claron deposit.
Before the cliffs, a place to collect sediment
Streams carried material into low basins. Water spread across floodplains and collected in lakes that changed in extent. Sand, silt, clay, and carbonate-rich deposits accumulated in different settings. The Claron story includes rivers, soils, and lakes, rather than one permanent, uniform body of water.
Look closer
Follow the stream into the basin. The dotted, lined, and pale beds distinguish materials; their thicknesses are illustrative.
Illustration Simplified burial and cementation illustration. Grain shapes, burial depth, and the section’s layers are schematic; carbonate rocks can also form through precipitation and later alteration.IllustrationSchematic section. Beds retain differences in composition and cementation. Those differences can later affect their resistance to weathering.
Burial and lithification
A process, not a single dated event. Different beds formed and changed at different times.
Loose deposits become a rock record
As sediment accumulates, older deposits are buried. Compaction reduces spaces between particles, and mineral cement can bind them together: lithification. The Claron includes limestone as well as muddier and sandier beds. A formation is a recognizable, mappable body of rock; a hoodoo is a later shape carved into it.
Look closer
Compare the loose grains with the joined grains. The exposed section organizes the idea of layering; it is not a sampled column from Thor’s Hammer.
Illustration Conceptual uplift and unroofing, with deliberately exaggerated relief. No local fault position, displacement, uplift rate, or ancient elevation is modeled.IllustrationSchematic section. Uplift changes elevation; erosion removes overlying material. The relative thickness of the colored beds does not measure either process.
Later uplift and exposure
A prolonged regional history. These chapters are not equal spans of time.
The rocks rise, and their cover is removed
Tectonic processes raised the Colorado Plateau region. Faulting also helped shape the High Plateaus. Meanwhile, erosion removed material and exposed older rocks. Raising a rock body and uncovering it are different processes, and they can overlap. No single lift in this illustration represents all of Bryce’s rise to its present elevation.
Look closer
The upward arrows show regional uplift. The dashed surface marks material removed by erosion; it does not show an exact former ground level.
Illustration Original process illustration after NPS descriptions. This is not a dated reconstruction of Natural Bridge or a calculated erosion simulation.IllustrationSchematic section. Weathering breaks down rock in place. Erosion transports the resulting material; the arrows show direction, not a measured rate.
After exposure · continuing today
A sequence of processes, with no assigned duration for a particular fin or opening.
Water works through the weaknesses
Joints divide the rock. Water entering cracks can freeze and widen them; slightly acidic water can dissolve carbonate. These are forms of weathering. Erosion carries loosened material away. Uneven resistance helps produce walls and fins, and openings can develop within them. A window is one possible step, not a compulsory history for every hoodoo.
Look closer
Read the crack and the opening separately. One shows a weakness; the other shows where material has been removed.
Illustration Illustrative hoodoos and fallen material. Different features have different histories; the diagram cannot establish the stability or lifespan of a real rock.IllustrationSchematic section. The rock layers extend through the surviving columns. Gaps show missing material, not younger rock deposited between pillars.
Younger landforms in older rock
No age or failure date is assigned to a real landmark.
Columns remain, and keep changing
When a connection between parts of a wall is lost, isolated columns can remain. More resistant layers project as ledges; weaker parts retreat. Thor’s Hammer makes those contrasts easy to see. Across Queen’s Garden, many forms coexist. Rockfall and runoff continue to change this landscape; a hoodoo is a temporary form, not a finished sculpture.
Look closer
Compare the wide ledges and narrow waists. These are explanatory shapes, not copies or forecasts of named landmarks.
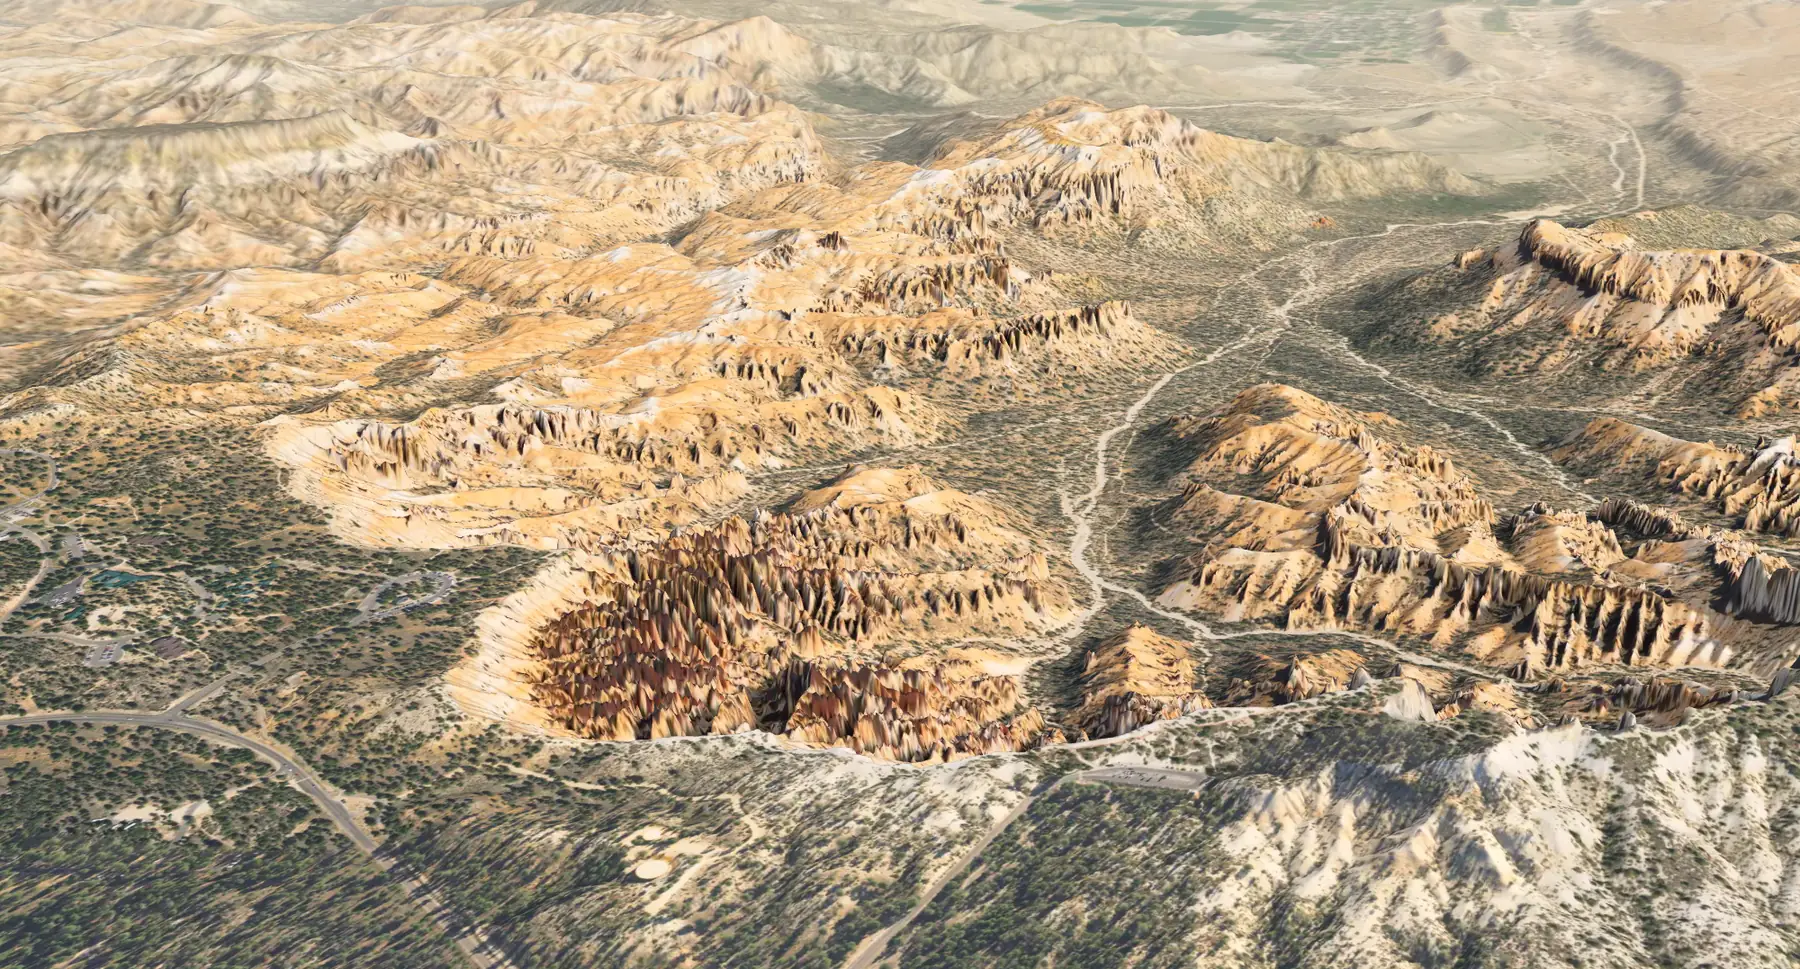
The terrain is a derived view of an acquired dataset, not a live observation.
Return to the landscape, with a better question
The age of the rock and the age of its shape ask different questions. Lidar helps describe the present surface; geology helps interpret the history that produced it. Neither gives a complete record. From an established trail or overlook, compare a wall with a column. Record what you see, leave the rock in place, and follow park barriers and current conditions.
Look closer
Return to the Atlas at the view you left, or visit Queen’s Garden. The modern terrain and the preceding ancient scenes have different kinds of evidence.
Bryce’s Claron sits toward the younger end of the regional sequence. Exposures to the south reveal older parts. The parks overlap in parts of that record, but do not preserve identical stacks.
North · Bryce regionSouth · Grand Canyon region
BryceYounger exposed strata
Zion regionA middle part of the sequence
Grand CanyonOlder exposed strata
Illustration Original conceptual cross-section after NPS regional explanations. Distances, slopes and thicknesses are not to scale; bands are not a full formation inventory. This is not a route or a view from one location.
A shared example is the Kaibab Formation: it caps much of the Grand Canyon rim and is exposed in a small part of Zion. Missing intervals, faults, and erosion complicate the picture. Read the regional field note and sources.
How long is that?
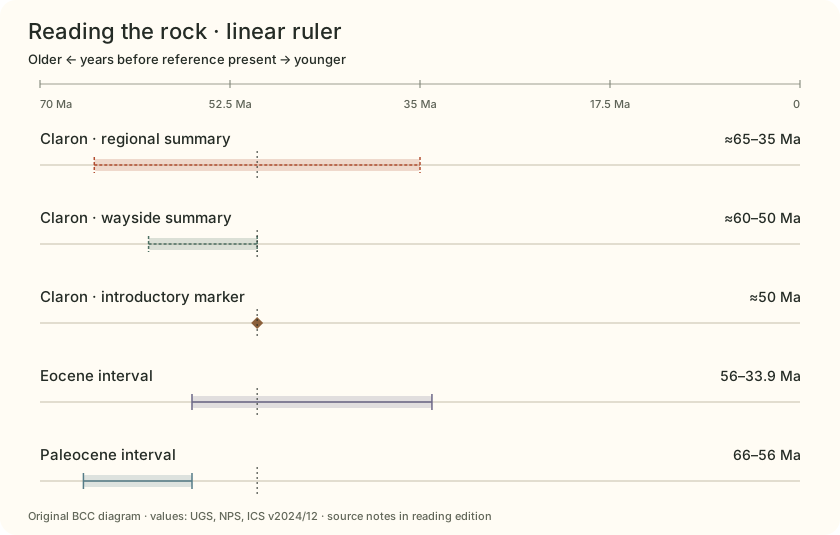
The National Park Service places the Claron’s lakes and floodplains at about 50 million years ago; a park wayside gives 50 to 60 million years, and the Utah Geological Survey a broader 65 to 35 million. The sources summarize differently, and none of the spans is an error bar. Earth itself is about 4.54 billion years old.
Rounded, about 91 spans of 50 million years fit into Earth’s age, and 50 million years is some 500,000 centuries. Neither number dates a hoodoo: the rock is old, but the shapes carved from it are much younger and still changing.
DerivedThree age summaries for the Claron (the NPS park page, a park wayside and the Utah Geological Survey) beside the Eocene and Paleocene epochs from the International Chronostratigraphic Chart, v2024/12. Chart by Bryce Canyon Conservancy.

 Illustration Interpreted lake and floodplain setting. Shorelines, relief, plants, and bed geometry are invented for explanation, not a reconstruction of a particular ancient view.
 Derived