Twelve ways to estimate, compare and question a number.
Use a calculator where helpful. The supplied quantities are enough: no visit, climbing, field measurement or live condition is assumed. All pictures are original teaching illustrations.
Rounding: follow each prompt. Keep unrounded intermediates. Ranges need both endpoints; the published ranges are not statistical confidence intervals.
Each numbered challenge starts on a fresh sheet. Diagrams are not rulers at physical print size. Full source notes and limits.Primary NPS and NIST references are linked with each exercise. Source facts checked 2 October 2026.
01 / 12 · Map scale · unit conversion
A road on your desk
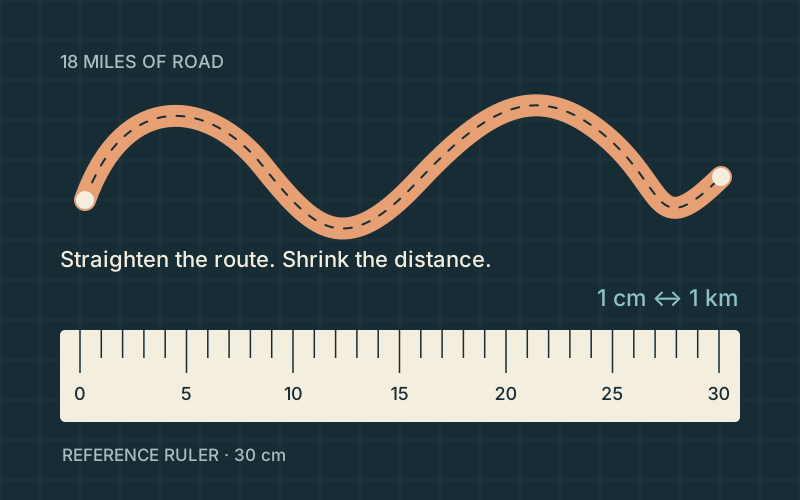
Original route-and-ruler diagram. The line is schematic, not a mapped road; the 30 cm ruler is a chosen reference.
About 29 cm
18 × 1.609344 = 28.968192 km → 28.968192 cm at this scale → about 29 cm.
The route would almost fill the chosen 30 cm ruler. Converting a published 18-mile approximation produces many calculator digits, but those digits do not establish a road length to the nearest meter. The sketch straightens the route; it is not a map of its bends.
Range / precision: The source length is approximate; no error bar is supplied. Whole-centimeter output is a teaching rounding choice.
Take it further. At 1:50,000, would the paper route get longer or shorter? Explain why it would take about 58 cm.
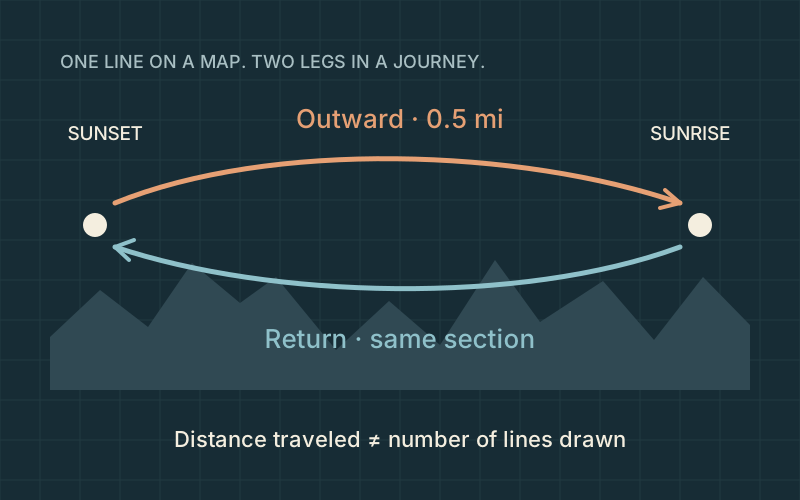
Original two-direction route schematic. Positions, bends and separation of arrows are illustrative.
About 1,600 m
2 × 0.5 mi = 1 mi; 1 × 1,609.344 = 1,609.344 m → about 1,600 m.
The same ground is traveled twice, so the journey is twice the one-way length. This is a distance calculation only: it says nothing about walking speed, ability, current access or total ascent. The schematic line supplies no navigation geometry.
Range / precision: Published distance is approximate. Nearest-100 m rounding avoids false precision.
Take it further. Why can a map show one line while a distance log counts two trips over it?
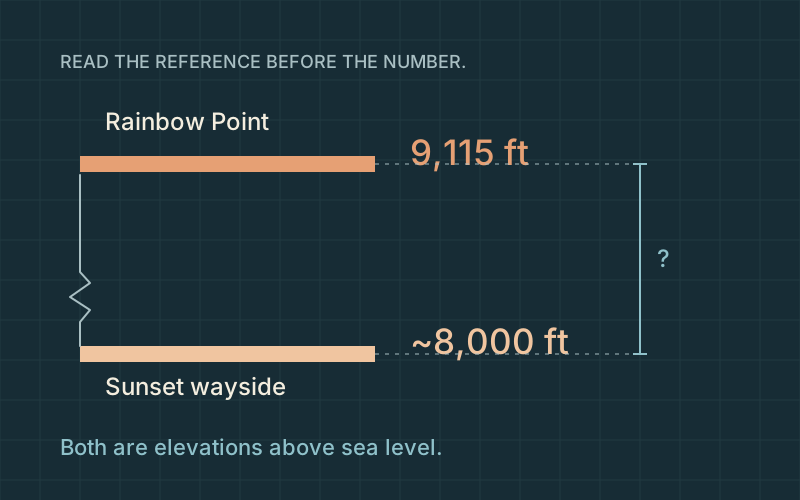
Original elevation comparison. The baseline is broken; the drawn terrain and horizontal separation are not measured.
About 340 m
(9,115 − 8,000) ft = 1,115 ft; 1,115 × 0.3048 = 339.852 m → about 340 m.
Subtract values with the same reference before converting. This is an approximate difference between two published elevations, not the height of a hoodoo or the total climbing on a route. The lower source is rounded, and neither page supplies a survey uncertainty for this comparison.
Range / precision: This subtraction does not create a precise measured difference from a rounded input.
Take it further. A trail can descend and climb between its endpoints. Why can cumulative ascent exceed their elevation difference?
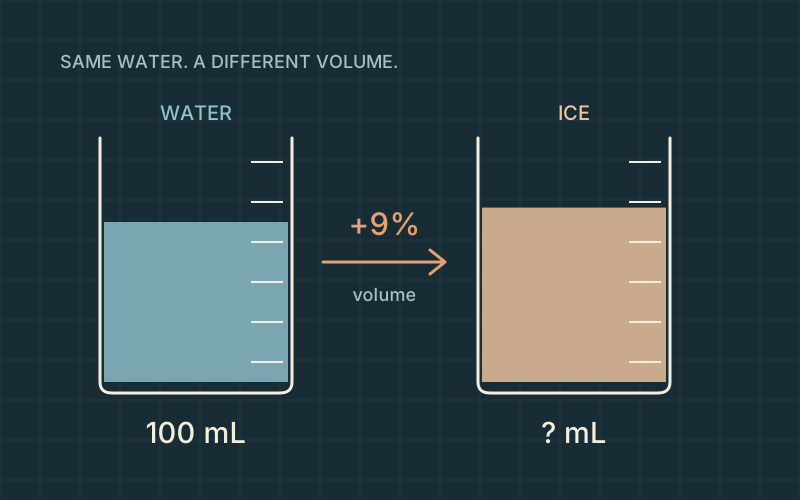
Original illustrative beakers. The starting sample is defined for teaching; the vessels are not laboratory measurements.
About 109 mL
100 × (1 + 9/100) = 109 mL.
Nine percent is the added volume, so the final amount includes both the starting 100 mL and the extra 9 mL. This is an idealized calculation. A container, crack, temperature or pressure can change what physically happens; the diagram is not an experiment or a crack-pressure prediction.
Range / precision: The 9% is an approximate physical explanation, not a tolerance for a measured sample.
Take it further. Under the same approximation, a 250 mL sample would gain 22.5 mL. How much would it occupy in total?
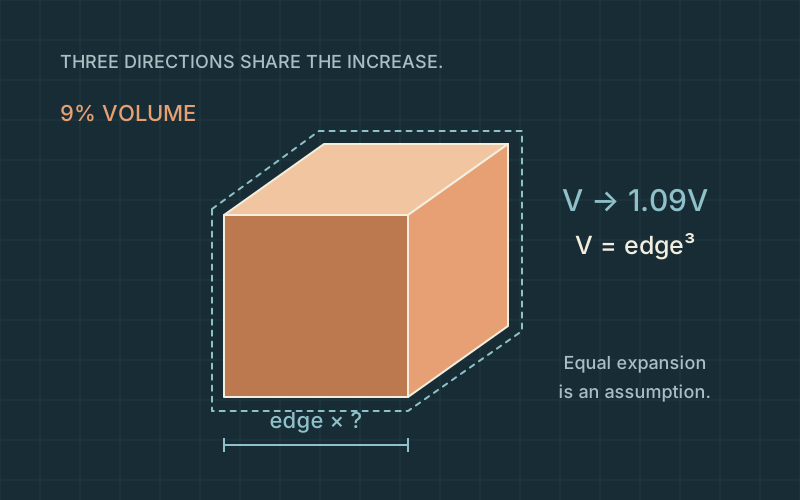
If each edge grew by 9%, the volume would multiply by 1.09³, approximately 1.295, or nearly 30% growth. A volume percentage cannot be applied directly to a length. Equal expansion in three axes is a teaching assumption, not a model of a real rock fracture.
Range / precision: Numerical precision here checks the mathematics; it does not make the 9% approximation more exact.
Take it further. Check your edge multiplier by cubing it. Does it recover approximately 1.09?
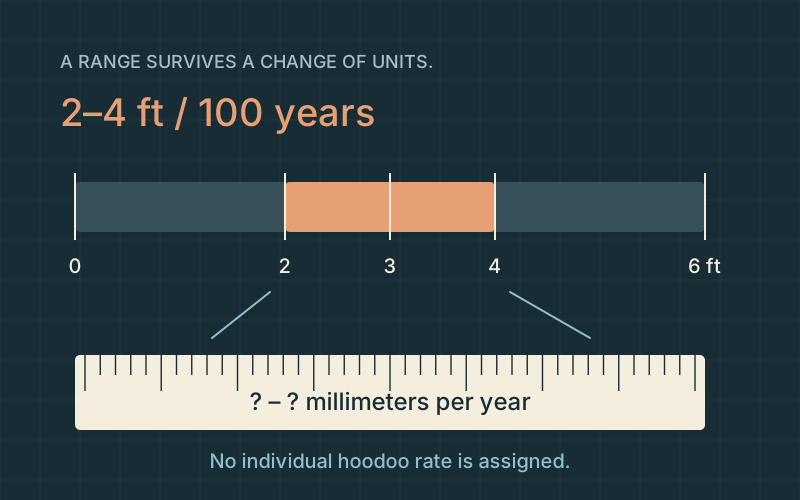
Convert both endpoints. A midpoint such as 9.1 mm/year hides the stated spread. The source range is not a statistical confidence interval, and real erosion can be episodic. This calculation does not assert that a specific hoodoo becomes this much shorter every year.
Range / precision: A published interpretive rate range; not site-specific uncertainty or a collapse forecast.
Take it further. The upper endpoint is twice the lower endpoint. Does that ratio survive the unit conversion?
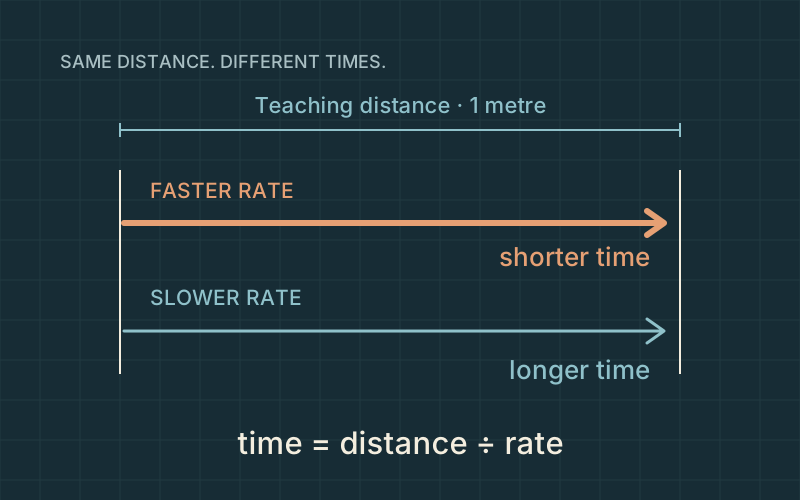
The faster rate gives the shorter time, so the rate endpoints reverse when you divide by them. This interval is a mathematical equivalent under an imposed constant-rate model. It is not a predicted erosion time or lifespan for any real hoodoo.
Range / precision: Source interval propagated through an inverse calculation; not a probabilistic prediction.
Take it further. Why would a single rockfall make a smooth, constant-rate story misleading?
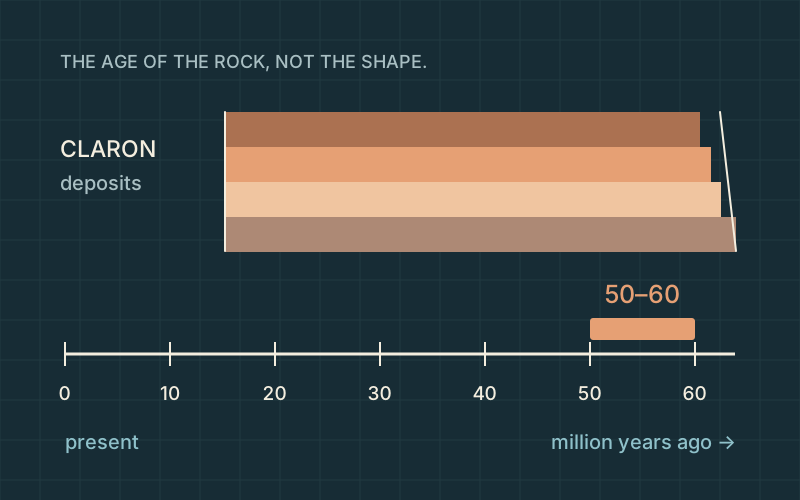
Original time ribbon and schematic layers. Bed thickness and the rock silhouettes are illustrative, not a measured section.
50–60 cm from the present
50 million / 1 million per cm = 50 cm; 60 million / 1 million per cm = 60 cm. The highlighted interval is 10 cm wide.
An age is a distance from the present on this ribbon; the span between the two ages is a duration. The rock-deposition interval is not the age of the modern hoodoos carved from that rock. The source is introductory interpretation, not a date for every Claron bed.
Range / precision: A formation-age interval, not a confidence interval or a hoodoo age.
Take it further. How would the two positions and the interval width change if 1 cm represented 2 million years?
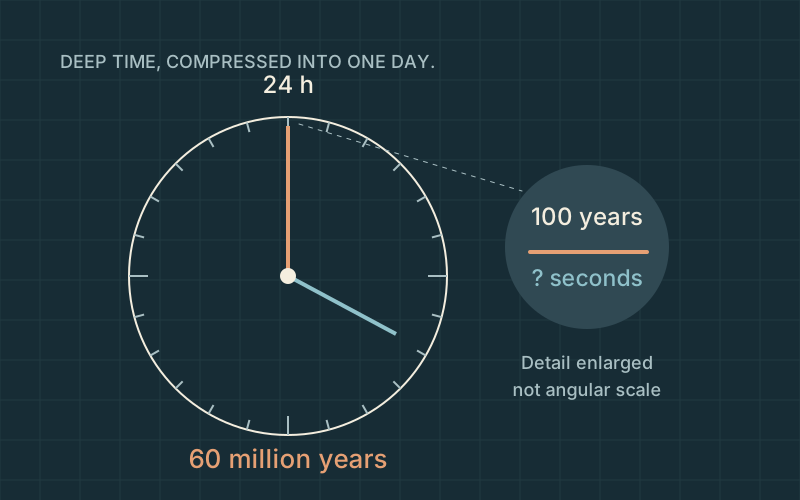
Original deep-time clock. The century detail is enlarged for visibility and is not drawn to angular scale.
0.144 seconds
100 / 60,000,000 × 86,400 = 0.144 seconds.
The ratio of real durations equals the ratio of display durations. A century occupies less than one fifth of a second in this deliberately compressed model. The clock is a scale analogy; it does not say that a geological process runs evenly or completes a cycle in a day.
Range / precision: 60 million years is a selected source endpoint, not an exact age or an assumed erosion duration.
Take it further. If the clock used 50 million years instead, the century would occupy 0.1728 seconds. Why does the shorter total make it larger?
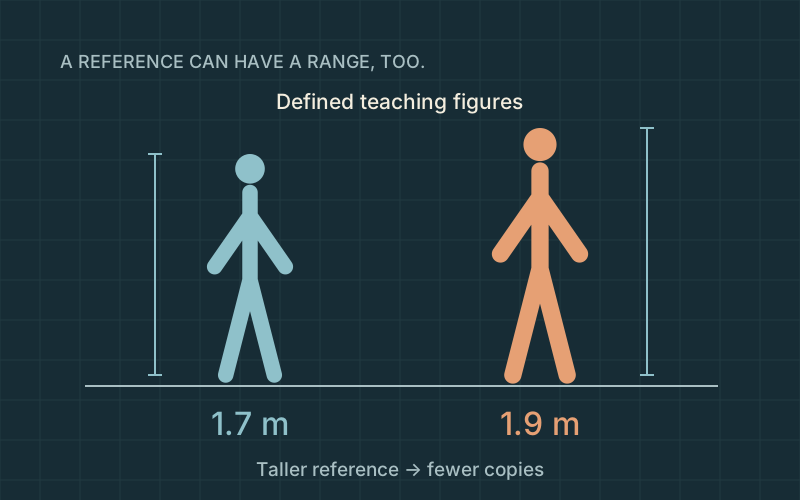
A taller reference means fewer copies fit into the same distance. The interval propagates only the chosen person-height range; it does not capture the unknown accuracy of the source elevations. These are defined reference figures, not measured people or a demographic claim.
Range / precision: Only the stated reference-height interval is propagated; source elevation uncertainty remains unquantified.
Take it further. Would using just 1.8 m show the full reference range? What information would the single ratio hide?
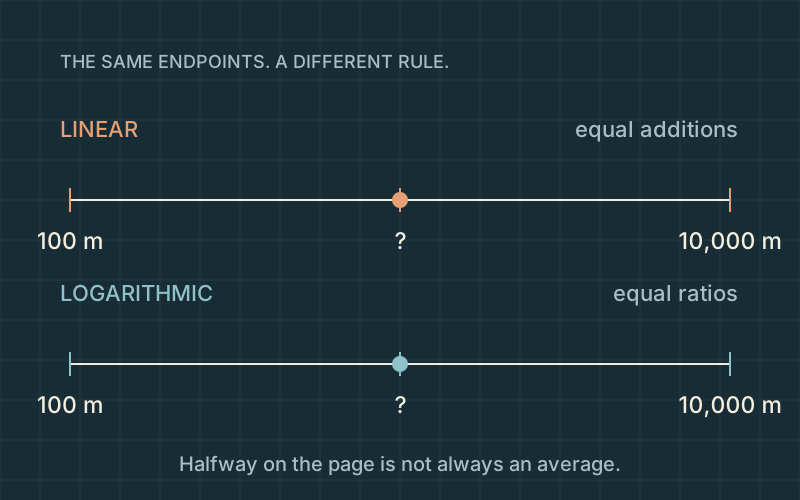
Original paired-axis diagram. The domain is a teaching choice; marks show spacing rules, not surveyed terrain.
Linear: 5,050 m · logarithmic: 1,000 m
Linear: (100 + 10,000) / 2 = 5,050 m. Logarithmic: √(100 × 10,000) = 1,000 m.
On the linear axis the two halves each add 4,950 m. On the log axis each half multiplies by 10. A log scale makes small and large values legible together, but it changes the meaning of visual spacing. Zero and negative values cannot appear on these logarithmic distance axes.
Range / precision: A mathematical domain for comparison, not an uncertainty interval.
Take it further. Try 1,000 m in the scale explorer. Why is it near the left end on a broad linear axis but well inside a log axis?
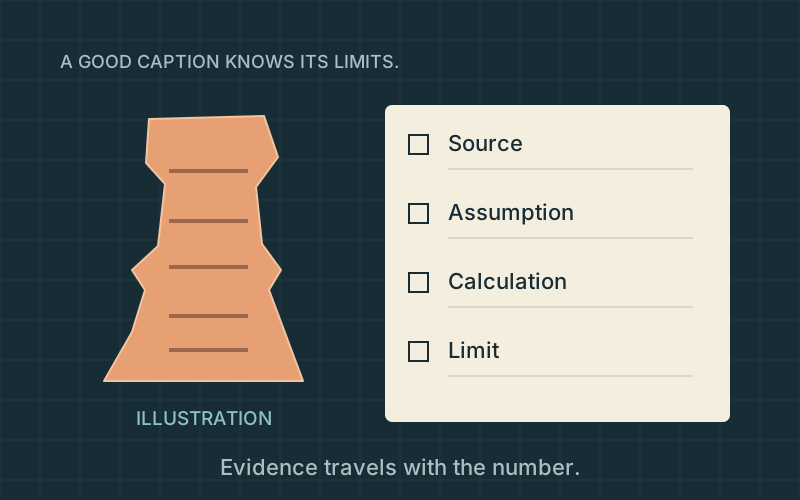
Original evidence-notebook illustration. The rock is imaginary; it is not Thor’s Hammer or a scan substitute.
Select the road-precision and rock-age captions.
Exact conversion ≠ exact source. Rock age ≠ landform age. Average erosion range ≠ failure date. Illustration ≠ survey.
A derived number inherits the limits of its inputs. Keeping a range and labeling an assumption can be more informative than adding decimals. Neither these diagrams nor legacy approximate landmark models supply a surveyed height. A ground scan and its own quality evidence would be separate work.
Range / precision: Source limits are part of an answer, even when the arithmetic is correct.
Supported: The published 18-mile road length is about 29 km; conversion digits do not improve the source precision.
Unsupported: The 2–4 ft per century range tells us the year a particular hoodoo will fall.
Supported: The 50–60 million-year interval describes the rock’s formation, not the age of the modern hoodoo shape.
Unsupported: A visually convincing model can establish a named hoodoo’s surveyed height without an independent measurement.
Take it further. Write a one-sentence caption for your favorite diagram that includes what it shows and one thing it cannot establish.