Twelve ways to estimate, compare and question a number.
Use a calculator where helpful. The supplied quantities are enough: no visit, climbing, field measurement or live condition is assumed. All pictures are original teaching illustrations.
Rounding: follow each prompt. Keep unrounded intermediates. Ranges need both endpoints; the published ranges are not statistical confidence intervals.
Each numbered challenge starts on a fresh sheet. Diagrams are not rulers at physical print size. Full source notes and limits.Primary NPS and NIST references are linked with each exercise. Source facts checked 2 October 2026.
Name / group: ______________________________________ Date: ___________________
01 / 12 · Map scale · unit conversion
A road on your desk
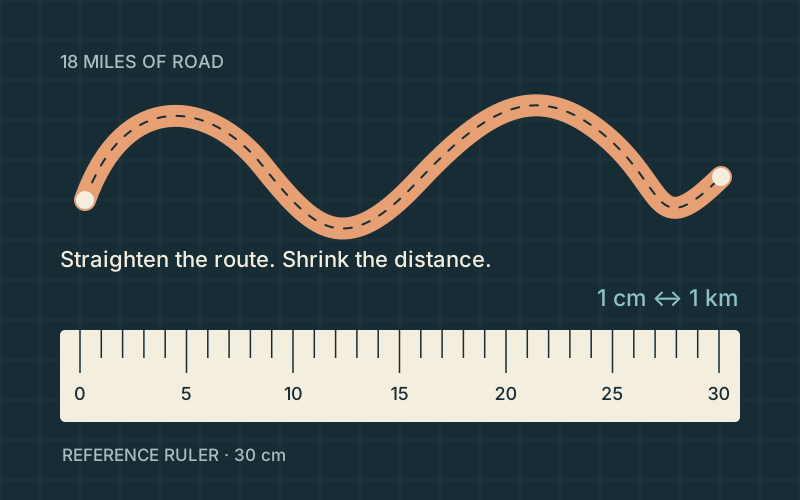
Original route-and-ruler diagram. The line is schematic, not a mapped road; the 30 cm ruler is a chosen reference.
NPS gives the full main park road as about 18 miles. Imagine straightening that route onto paper at 1:100,000: 1 cm on paper represents 1 km outside. How many centimeters would the route occupy? Use 1 mile = 1.609344 km. Round to the nearest centimeter.
Length on paper: ____________________ cm
Reasoning / working
Take it further. At 1:50,000, would the paper route get longer or shorter? Explain why it would take about 58 cm.
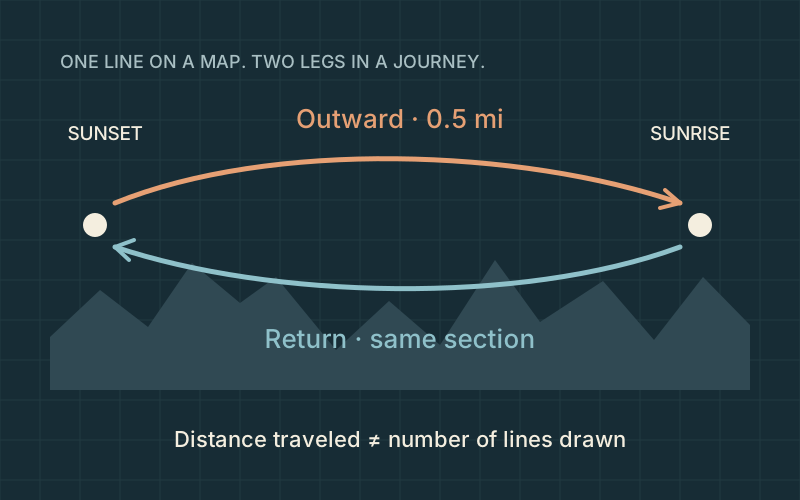
Original two-direction route schematic. Positions, bends and separation of arrows are illustrative.
The NPS distance between Sunset and Sunrise Points along the Rim Trail is about 0.5 mile one way. For an out-and-back exercise along that same section, what total distance is covered in meters? Use 1 mile = 1,609.344 m. Round to the nearest 100 m.
Total out-and-back distance: ____________________ m
Reasoning / working
Take it further. Why can a map show one line while a distance log counts two trips over it?
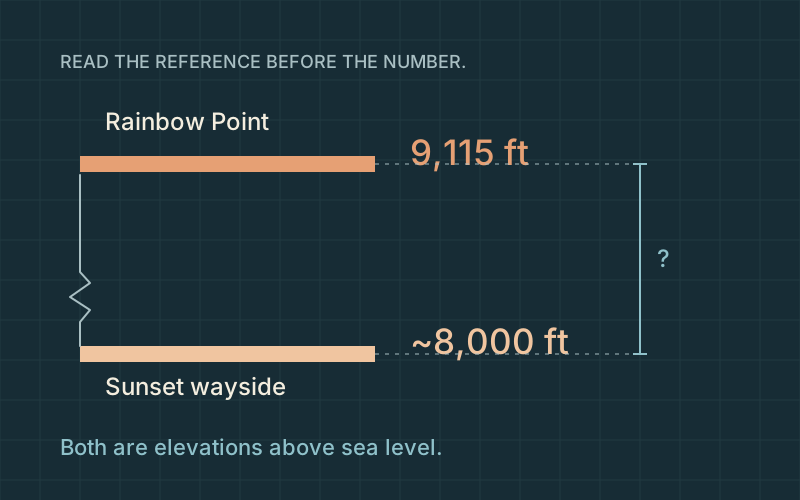
Original elevation comparison. The baseline is broken; the drawn terrain and horizontal separation are not measured.
NPS lists Rainbow Point at 9,115 ft; its Sunset Point wayside describes the Claron cliffs at about 8,000 ft. Using those published numbers, estimate the vertical difference in meters. Use 1 ft = 0.3048 m and round to the nearest 10 m.
Difference in elevation: ____________________ m
Reasoning / working
Take it further. A trail can descend and climb between its endpoints. Why can cumulative ascent exceed their elevation difference?
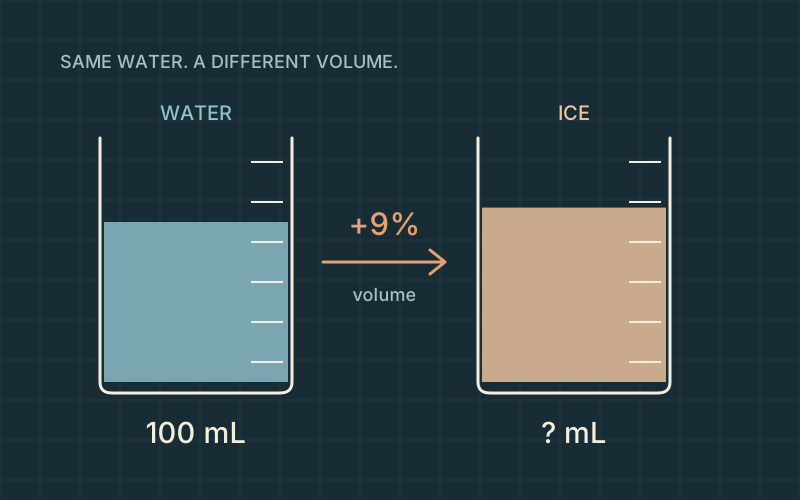
Original illustrative beakers. The starting sample is defined for teaching; the vessels are not laboratory measurements.
NPS uses about 9% volume expansion to explain ice wedging. For a mathematical example, start with 100 mL of water and allow the resulting ice to expand freely. What volume does that approximation give after freezing? Round to the nearest milliliter.
Final volume: ____________________ mL
Reasoning / working
Take it further. Under the same approximation, a 250 mL sample would gain 22.5 mL. How much would it occupy in total?
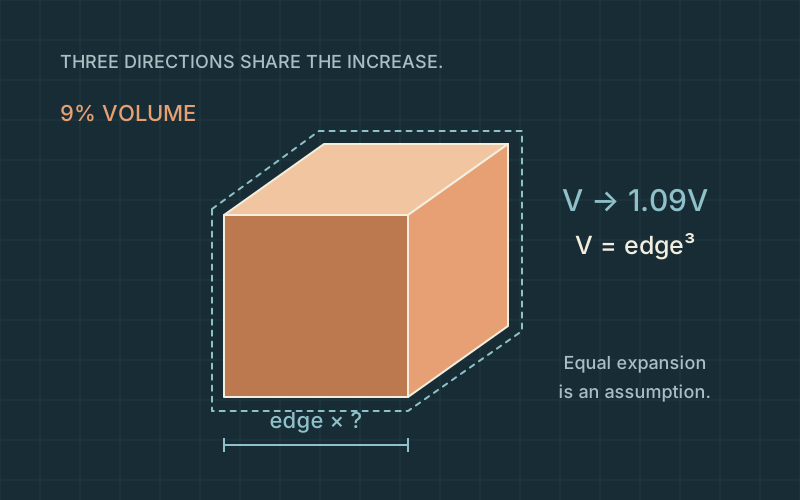
Original cube and dimension diagram. Perspective and expansion are emphasized for explanation; no rock geometry is measured.
Use the same 9% volume increase, but imagine an ideal cube expanding equally in all three directions. By what percent would each edge length increase? The new volume is 1.09 times the original volume. Use a cube root and round the percent to the nearest 0.1%.
Increase in each edge: ____________________ %
Reasoning / working
Take it further. Check your edge multiplier by cubing it. Does it recover approximately 1.09?
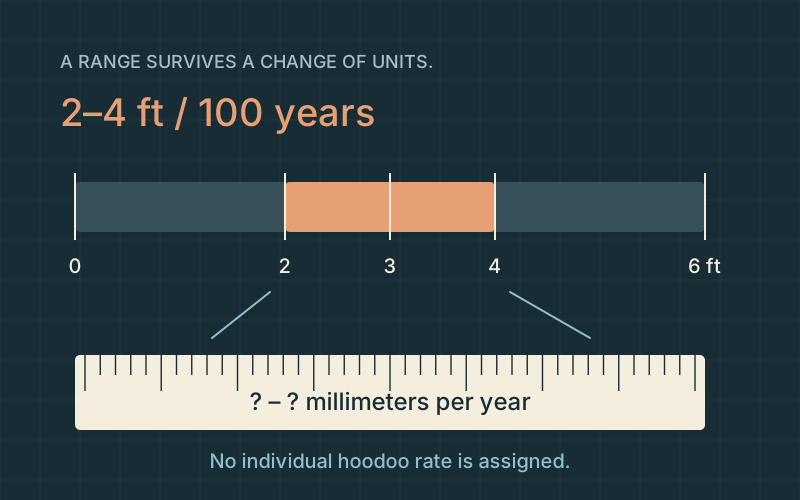
Original range-and-ruler diagram. The broad NPS interval is shown without assigning it to a particular rock.
NPS gives a broad interpretive erosion estimate of 2–4 feet per 100 years. Express both endpoints as millimeters per year, treating the stated average as uniform only for this calculation. Use 1 ft = 304.8 mm. Round each endpoint to the nearest 0.1 mm/year.
Lower rate: ____________________ mm/year
Upper rate: ____________________ mm/year
Reasoning / working
Take it further. The upper endpoint is twice the lower endpoint. Does that ratio survive the unit conversion?
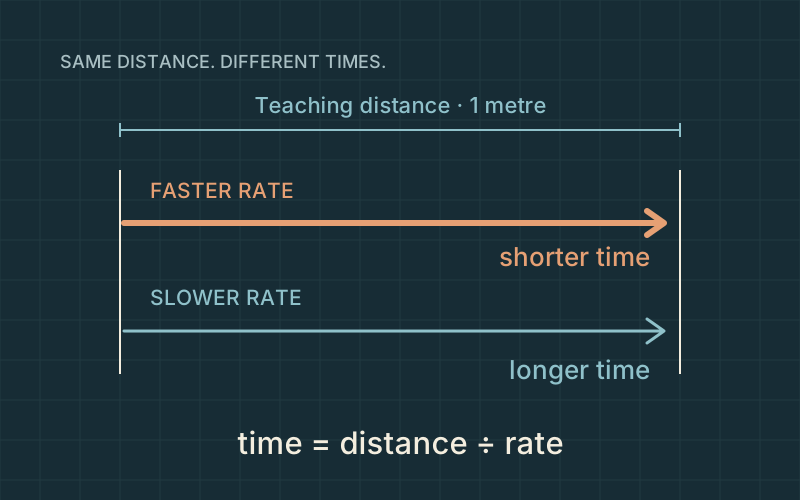
Original inverse-rate diagram. The shared 1 m distance is hypothetical; the clocks do not forecast an event.
As a unit exercise only, how many years correspond to 1 meter at the endpoints of the 2–4 ft per 100 years estimate? Assume a constant rate for the calculation. Use 1 ft = 0.3048 m. Give the shorter and longer times, rounded to the nearest year.
Shorter time: ____________________ years
Longer time: ____________________ years
Reasoning / working
Take it further. Why would a single rockfall make a smooth, constant-rate story misleading?
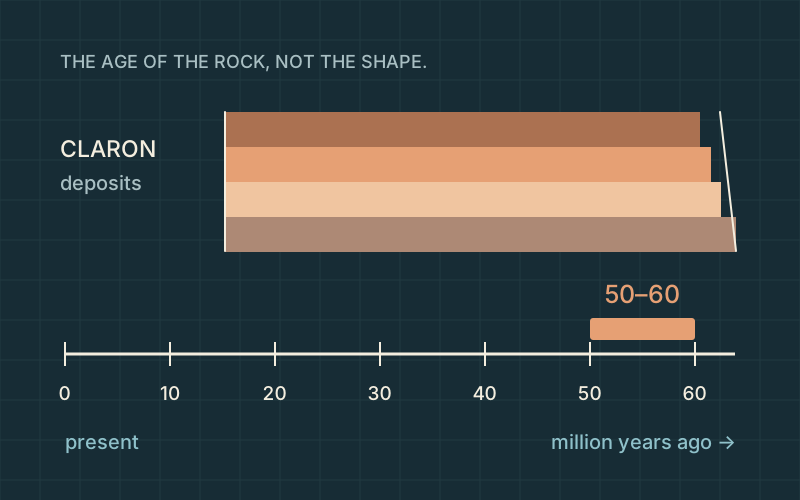
Original time ribbon and schematic layers. Bed thickness and the rock silhouettes are illustrative, not a measured section.
The NPS Sunset Point wayside places Claron deposition around 50–60 million years ago. On a classroom ribbon where 1 cm represents 1 million years, with the present at 0, how far from the present do the younger and older ends sit? Enter both distances in centimeters.
Younger endpoint from present: ____________________ cm
Older endpoint from present: ____________________ cm
Reasoning / working
Take it further. How would the two positions and the interval width change if 1 cm represented 2 million years?
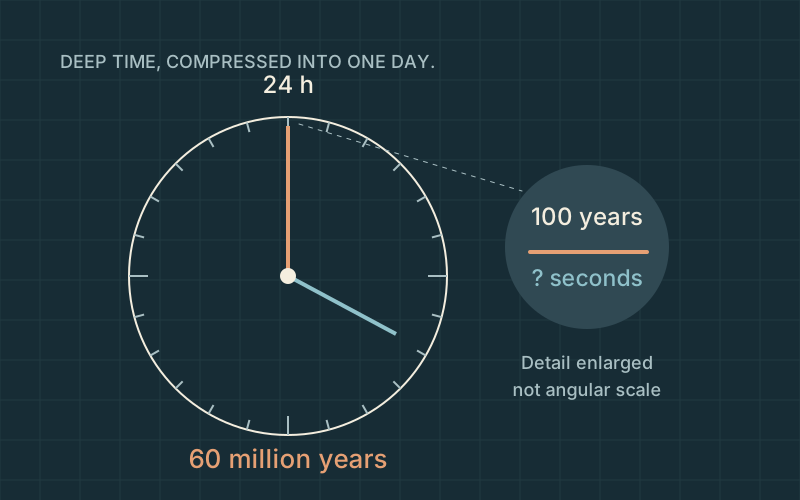
Original deep-time clock. The century detail is enlarged for visibility and is not drawn to angular scale.
Choose the older 60-million-year endpoint as a teaching clock’s full 24-hour span. If this mapping is uniform, how many seconds on the clock would represent 100 real years? Use 24 hours = 86,400 seconds. Round to the nearest 0.001 second.
Time on the teaching clock: ____________________ seconds
Reasoning / working
Take it further. If the clock used 50 million years instead, the century would occupy 0.1728 seconds. Why does the shorter total make it larger?
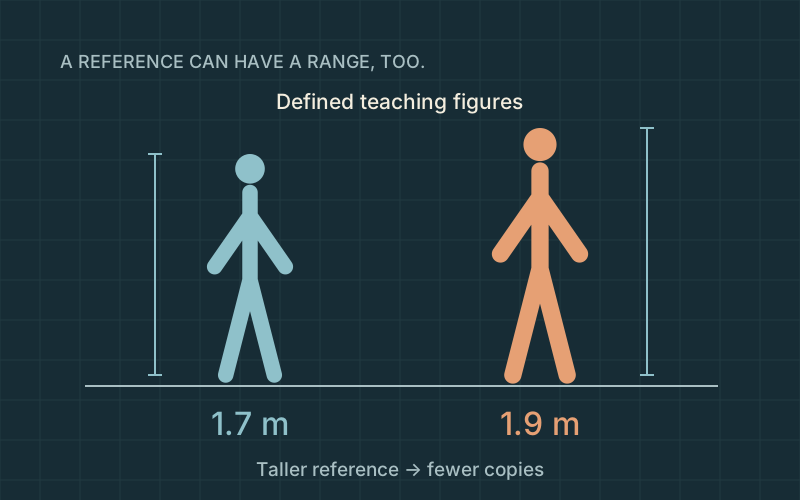
Original reference figures. Heights of 1.7 and 1.9 m are teaching assumptions; the elevation is not a hoodoo height.
Use the published elevation difference (9,115 − 8,000) ft and convert with 0.3048 m per foot. Now compare it with a teaching person-height range of 1.7–1.9 m. How many reference heights span that difference? Keep the unrounded difference until the end; round the two counts to whole numbers.
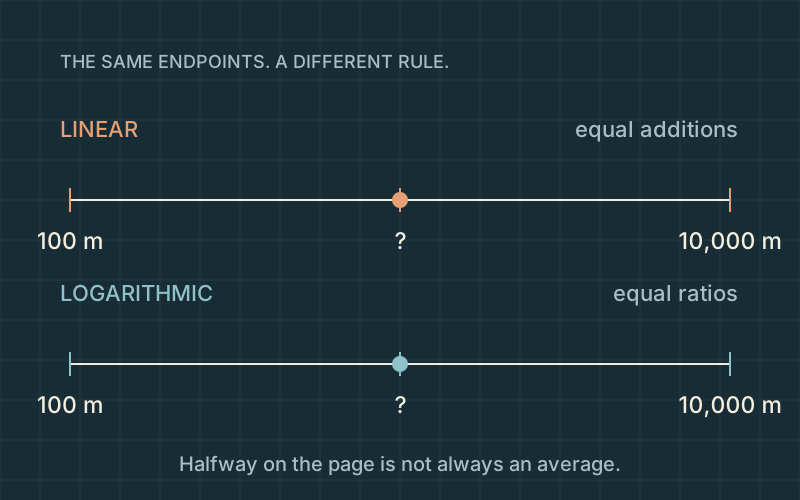
Original paired-axis diagram. The domain is a teaching choice; marks show spacing rules, not surveyed terrain.
A comparison axis spans 100–10,000 m, bracketing the published 2,778 m elevation of Rainbow Point. What value belongs halfway along a linear axis, and what value belongs halfway along a logarithmic axis? Give both in meters, to the nearest meter. These are axis midpoints, not new park measurements.
Linear midpoint: ____________________ m
Logarithmic midpoint: ____________________ m
Reasoning / working
Take it further. Try 1,000 m in the scale explorer. Why is it near the left end on a broad linear axis but well inside a log axis?
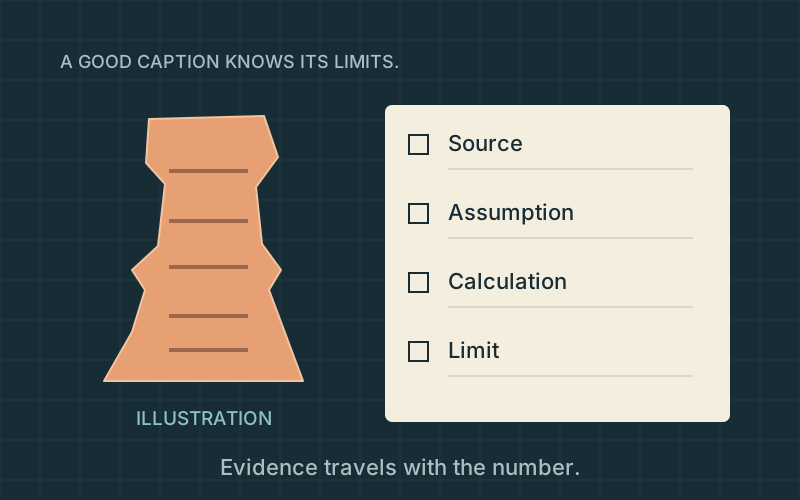
Original evidence-notebook illustration. The rock is imaginary; it is not Thor’s Hammer or a scan substitute.
An exhibit editor is checking four captions. Select every caption supported by the quantities and source limits in this activity. Two are supportable. Think about rounded inputs, rock age, illustrative models and the difference between an average rate and a prediction.
□ The published 18-mile road length is about 29 km; conversion digits do not improve the source precision.
□ The 2–4 ft per century range tells us the year a particular hoodoo will fall.
□ The 50–60 million-year interval describes the rock’s formation, not the age of the modern hoodoo shape.
□ A visually convincing model can establish a named hoodoo’s surveyed height without an independent measurement.
Reasoning / working
Take it further. Write a one-sentence caption for your favorite diagram that includes what it shows and one thing it cannot establish.