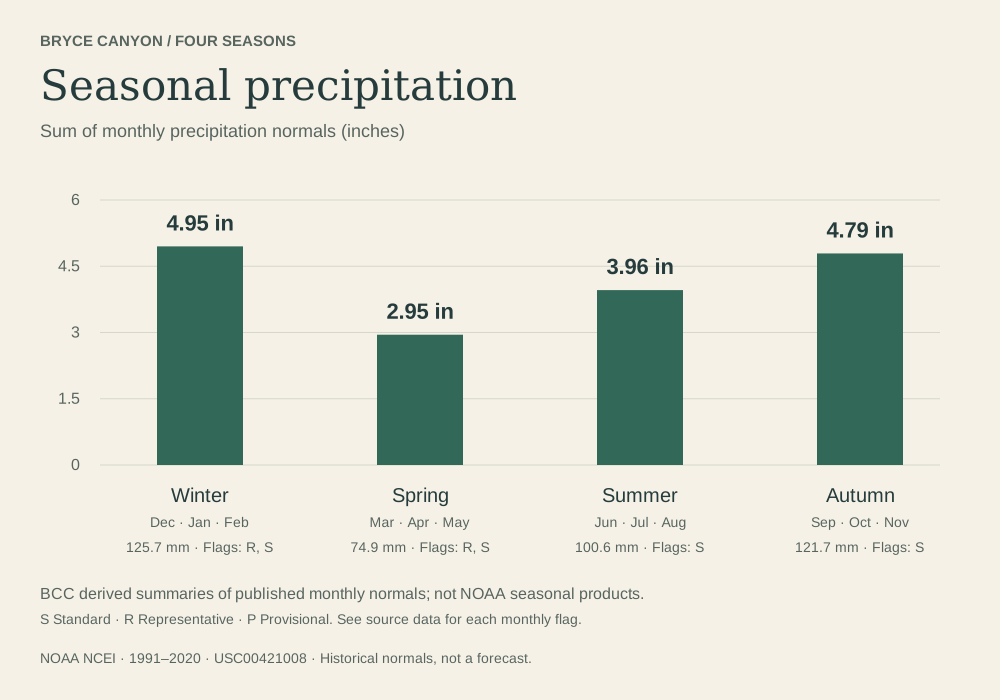
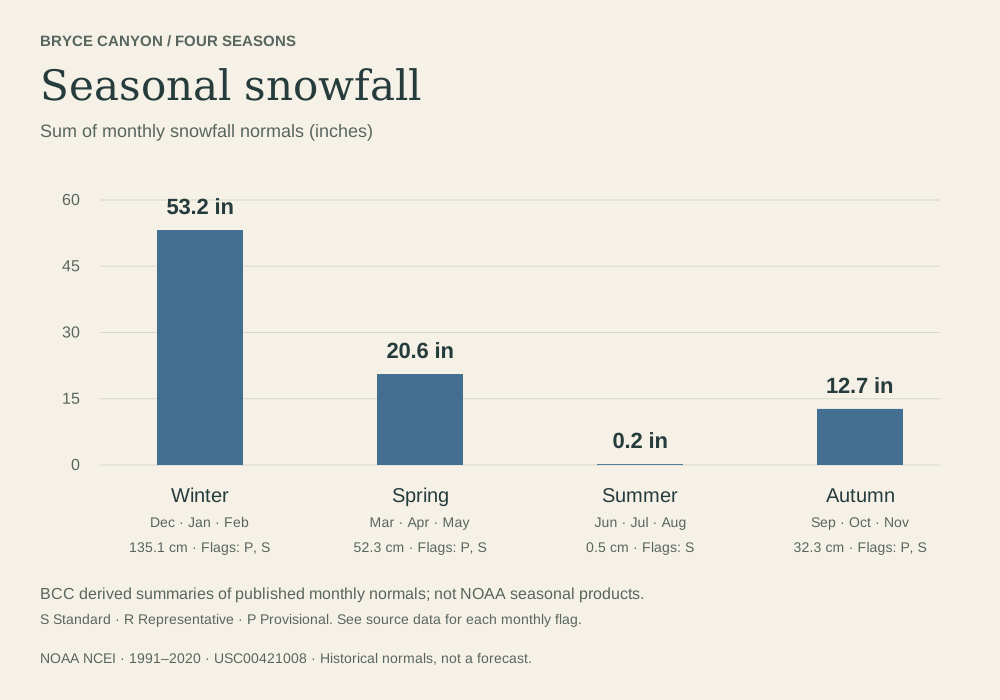
Park headquarters
USC00421008
- Position
- 37.6411° N · 112.1703° W
- Elevation
- 2,404.9 m · about 7,890 ft
- Record
- Temperature, precipitation, snowfall

Weather unavailable
Observed at Bryce Canyon Airport. Conditions at the rim can differ.
NWS · KBCE airport · time unavailable
Forecast unavailable. Use the NWS source below.
Forecast issue time unavailable
Park updates unavailable
Check NPS for the latest closures and conditions.
The page reads in full without it; the interactive tools load only when you ask.
Cold nights. Summer warmth.
A landscape of changing seasons.
Thirty years of weather become a seasonal portrait. Explore the monthly normals for Bryce Canyon’s headquarters and a nearby airport.
A normal describes a historical average. Any particular day, month, or year can be very different.
How to read these numbers01 / THE CALENDAR
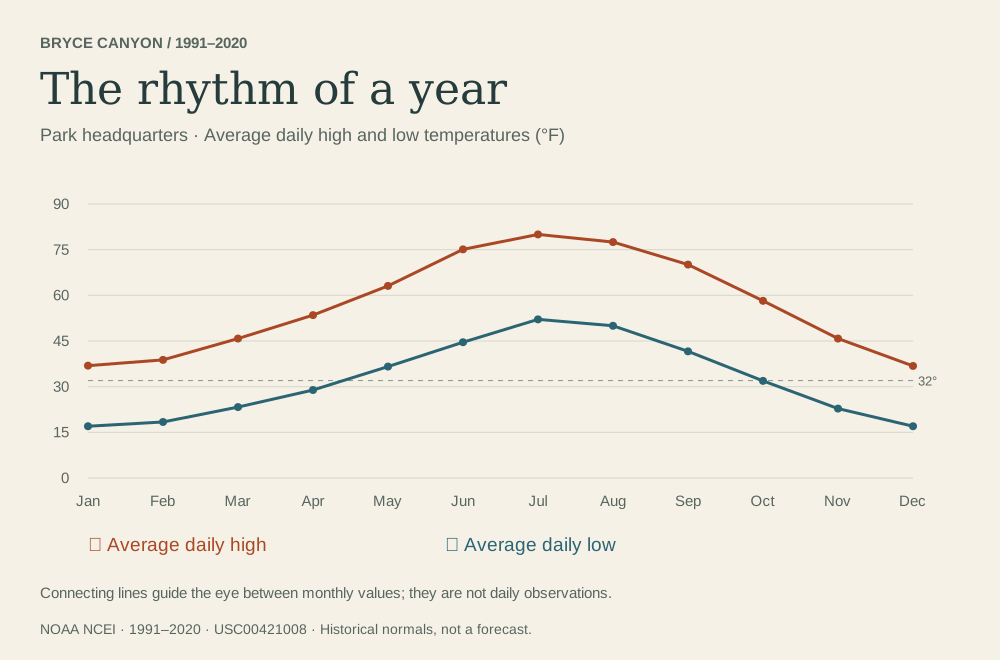
 Derived Park headquarters · 1991–2020. All values and source flags appear in the complete tables below.
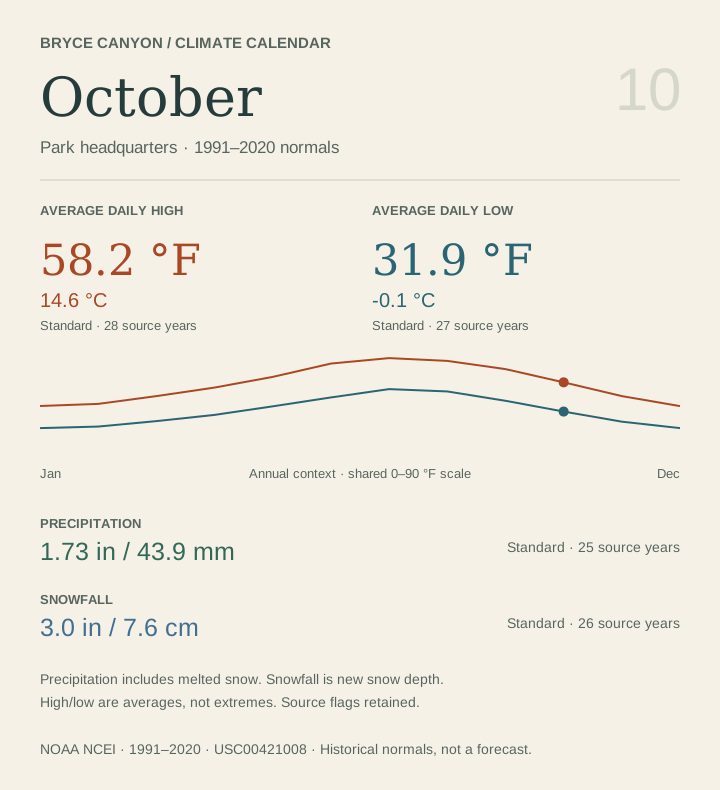
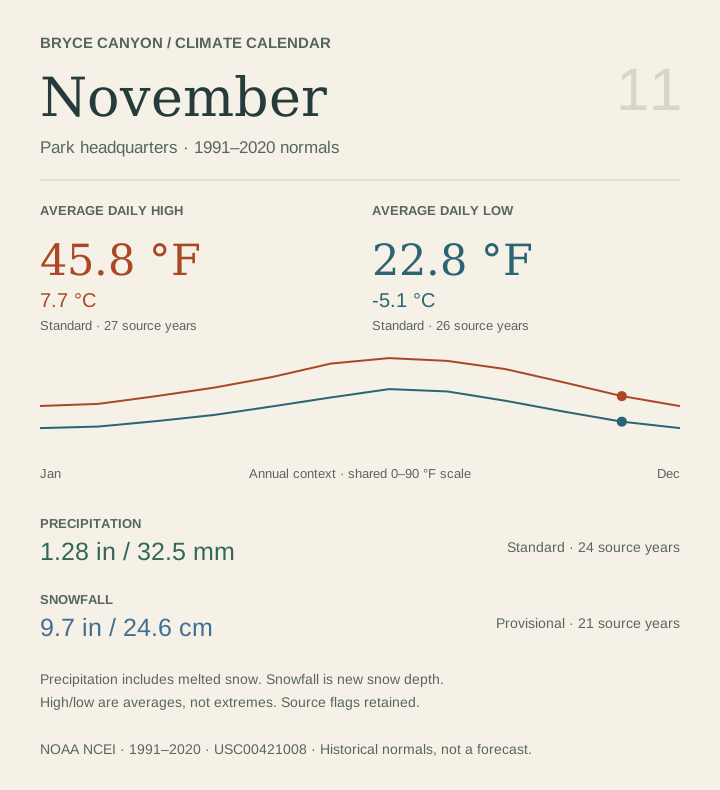
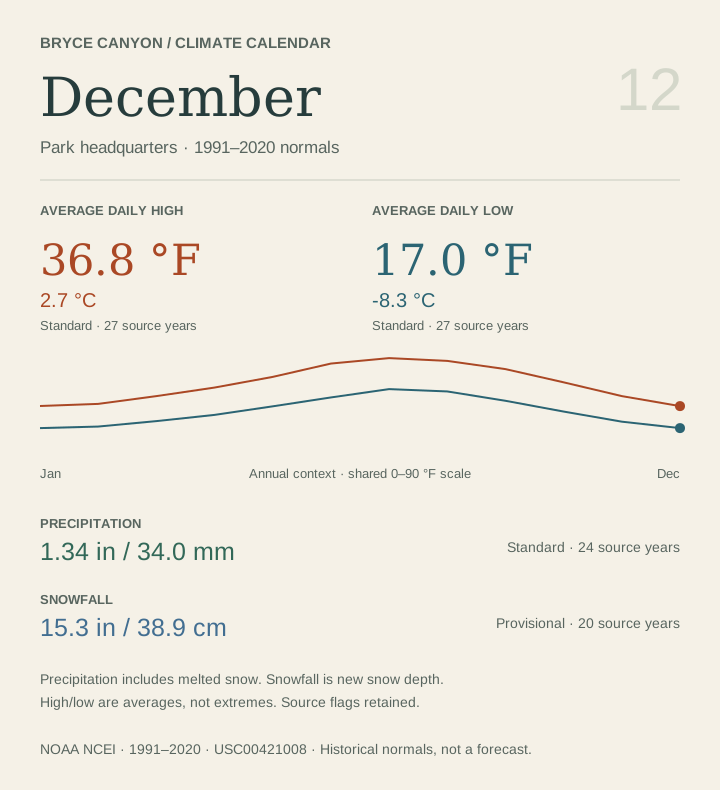
Temperature is the monthly average of daily highs and lows, not the hottest and coldest days.
Precipitation is liquid-equivalent water, including melted snow. Snowfall is new snow depth, not snow on the ground. Do not add the two.
02 / A SENSE OF PLACE
About 7.6 km separates these points.
They describe different places.
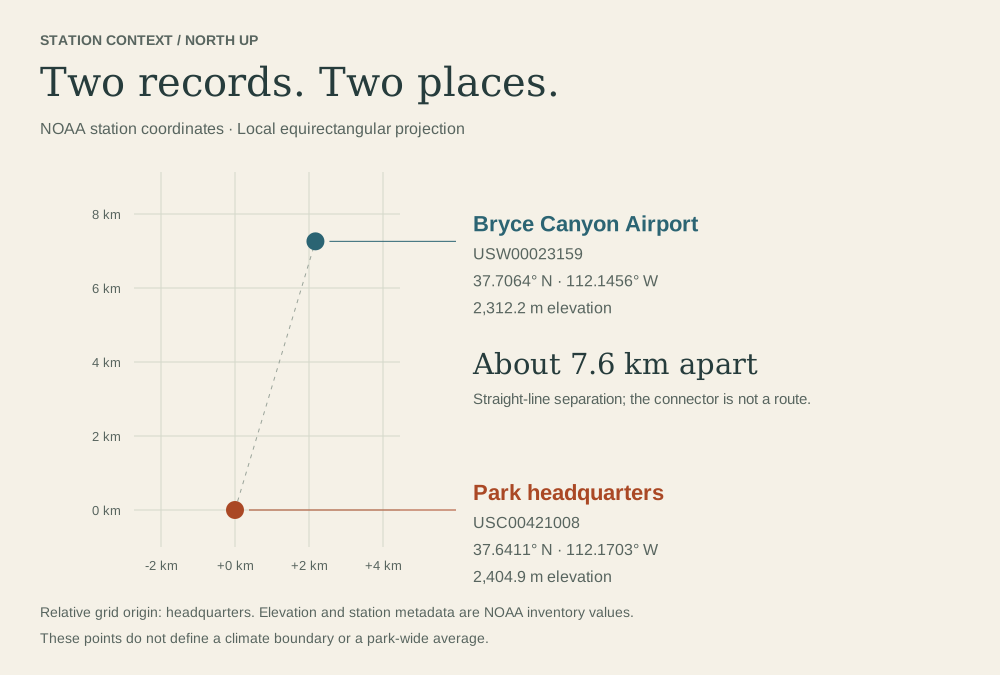 Derived NOAA inventory coordinates and elevations. The line connects stations; it is not a road or trail. Download map SVG
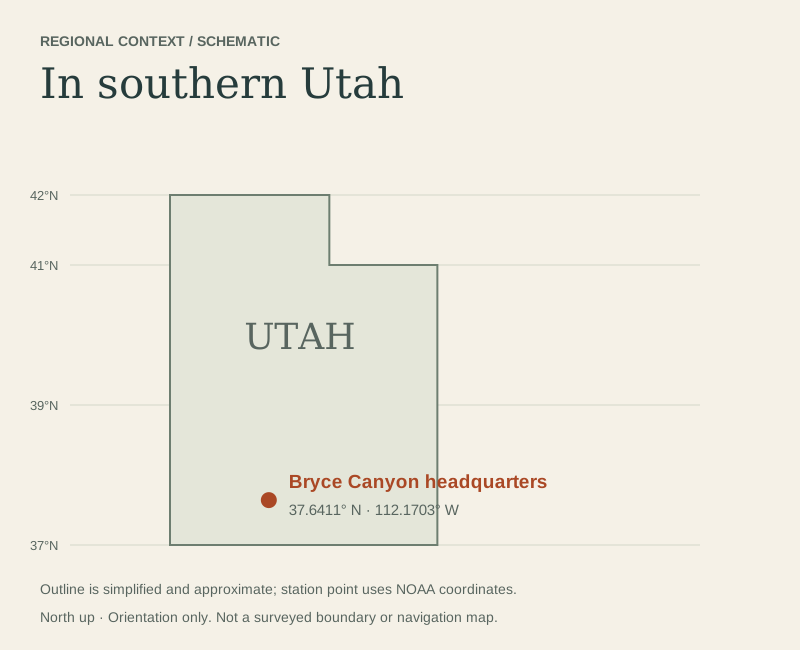 DerivedFrom NOAA’s 1991–2020 station normals.
Elevation, exposure, and local terrain vary across Bryce. Neither record is a park-wide average. The difference between these two stations is not an elevation-only experiment.
Station metadata describes the published normals product. It does not establish the complete history of station moves or instruments.
USC00421008
USW00023159
03 / READING THE RECORD
NOAA’s normal period is 1991–2020. Available years vary by station, month, and variable. NOAA may estimate gaps from nearby stations. Every published value keeps its source-year count and completeness flag here.
The airport file does not publish snowfall normals. “Not available” preserves that absence. At headquarters, July–September snowfall is published as 0.0 inches; that rounded historical normal does not guarantee no snow.
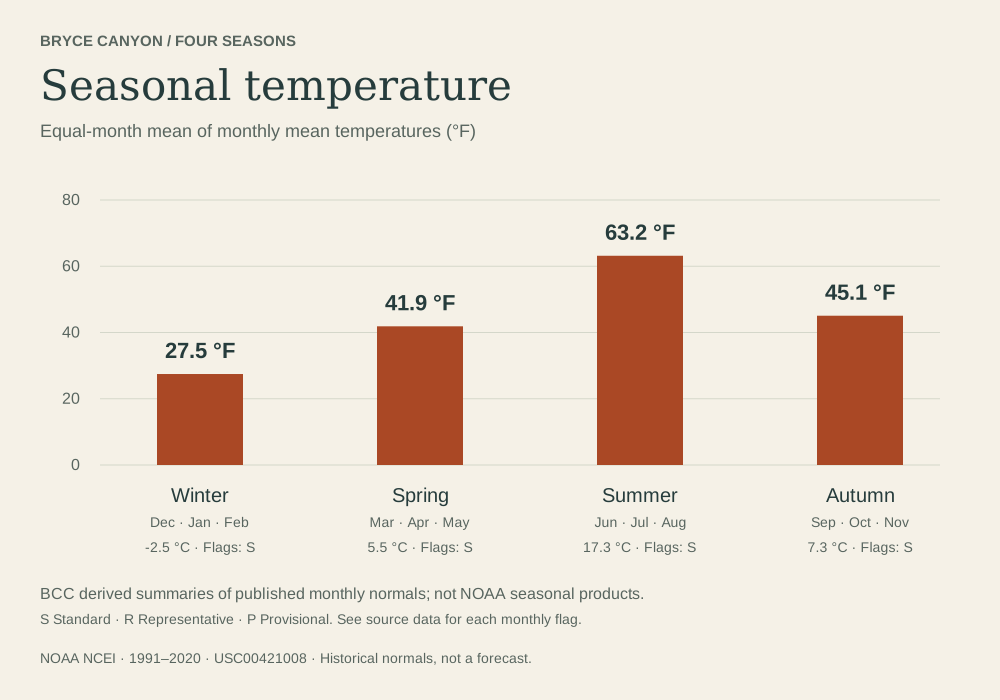
Our seasonal amounts add three monthly normals. Temperatures use an equal-weight average of the three monthly normals. These are BCC calculations, distinct from NOAA’s separately published seasonal products.
NOAA’s X measurement flag means a nonzero value rounded to zero. It is different from an explicit trace amount. Neither X nor trace appears in our selected five monthly variables. The data adapter preserves both states and never invents an amount for a trace.
The year count and flag are distinct source attributes; they are retained as published. They are not confidence scores or a guarantee of a complete daily record.
Data retrieved October 2, 2026 from NOAA NCEI U.S. Climate Normals. All numeric displays use these two monthly files: headquarters USC00421008 and airport USW00023159.
Station metadata is cross-checked against NOAA’s 30-year station inventory. Definitions and flags follow the monthly documentation and CSV format guide.
Conversions: °C = (°F − 32) × 5/9; precipitation mm = inches × 25.4; snowfall cm = inches × 2.54. Values are converted before display rounding. NOAA’s mean temperature is retained directly; it is not recalculated from the displayed high and low.
Normals are statistical products derived from observations and NOAA adjustments, not raw measurements. Connecting lines guide the eye between months, not between daily observations. No probability of a particular condition is implied. Snowfall totals describe accumulation over time, not standing snow depth.
The NPS weather page provides visitor context, but its summary table does not identify a matching normal period or station. Its numbers are not mixed into this calendar. Current forecasts, road status, and trail access must be checked separately.
NOAA data are credited to NOAA/NCEI; original graphics and conversions are by BCC. No photograph, basemap, or government insignia is reproduced. This educational work does not imply NOAA or NPS endorsement. Read attribution and reuse notes.
04 / THE PRINT COLLECTION
Scalable SVGs with source notes.
Monthly cards in both unit systems.
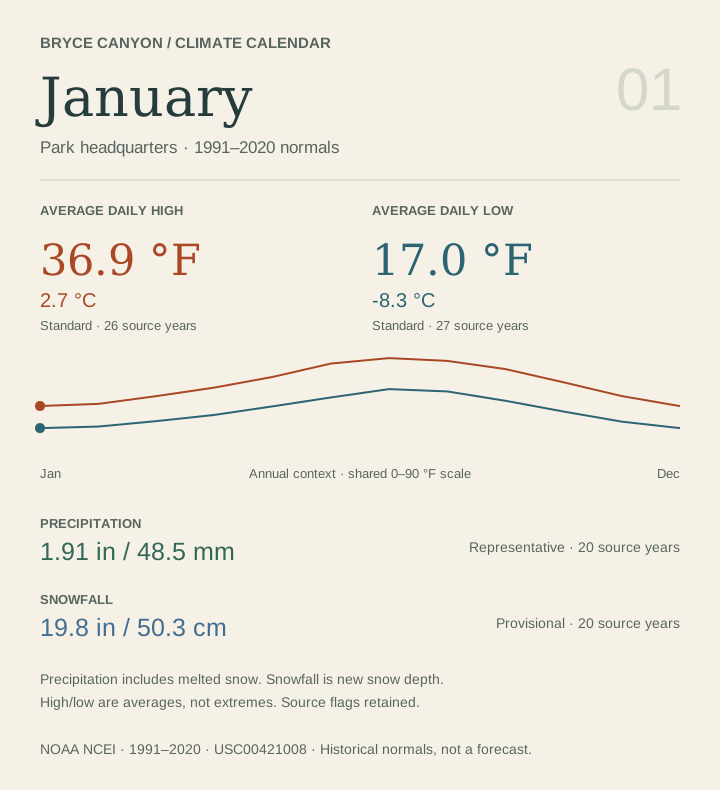 DerivedFrom NOAA’s 1991–2020 station normals.
SVG text stays selectable and sharp when printed. Open a file to print, or save it to use in a lesson.
05 / THE COMPLETE RECORD
These tables remain available without the interactive explorer. On a narrow screen, focus a table and scroll horizontally to read all columns.
USC00421008 · 1991–2020 · 2,404.9 m
| Month | Average daily high | Average daily low | Mean temperature | Precipitation | Snowfall |
|---|---|---|---|---|---|
| January | 36.9 °F(2.7 °C)S · 26 yr | 17.0 °F(-8.3 °C)S · 27 yr | 26.9 °F(-2.8 °C)S · 26 yr | 1.91 in(48.5 mm)R · 20 yr | 19.8 in(50.3 cm)P · 20 yr |
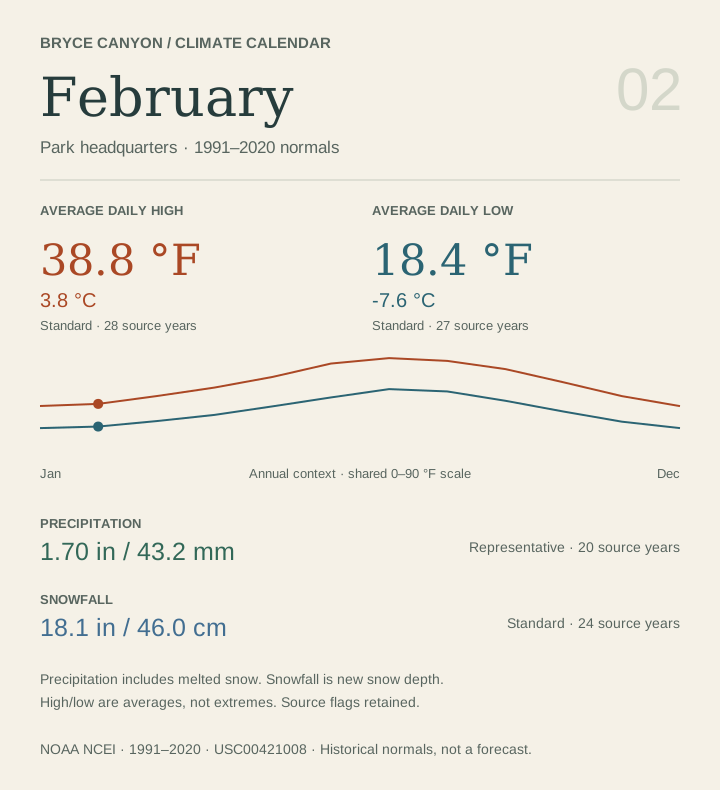
| February | 38.8 °F(3.8 °C)S · 28 yr | 18.4 °F(-7.6 °C)S · 27 yr | 28.6 °F(-1.9 °C)S · 27 yr | 1.70 in(43.2 mm)R · 20 yr | 18.1 in(46.0 cm)S · 24 yr |
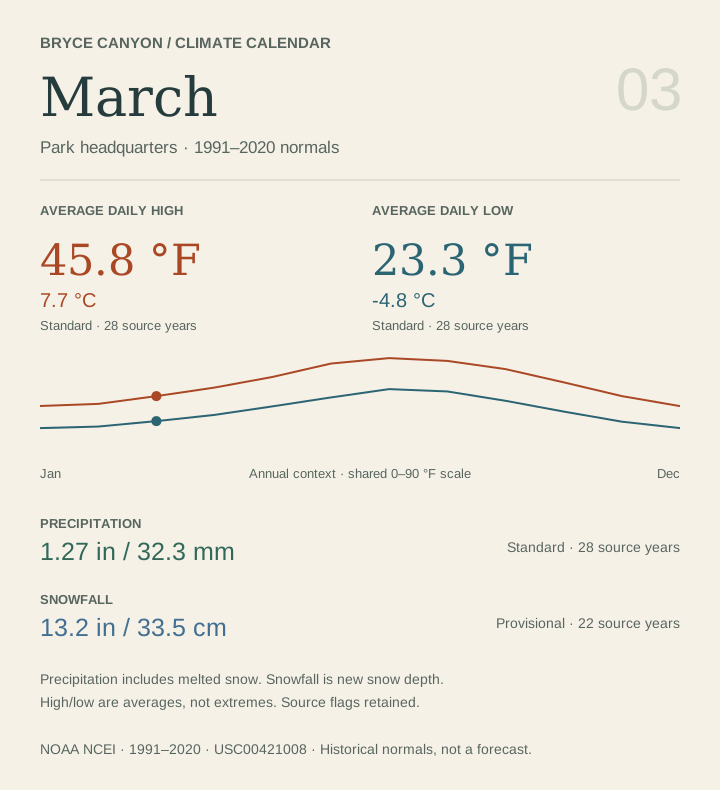
| March | 45.8 °F(7.7 °C)S · 28 yr | 23.3 °F(-4.8 °C)S · 28 yr | 34.5 °F(1.4 °C)S · 28 yr | 1.27 in(32.3 mm)S · 28 yr | 13.2 in(33.5 cm)P · 22 yr |
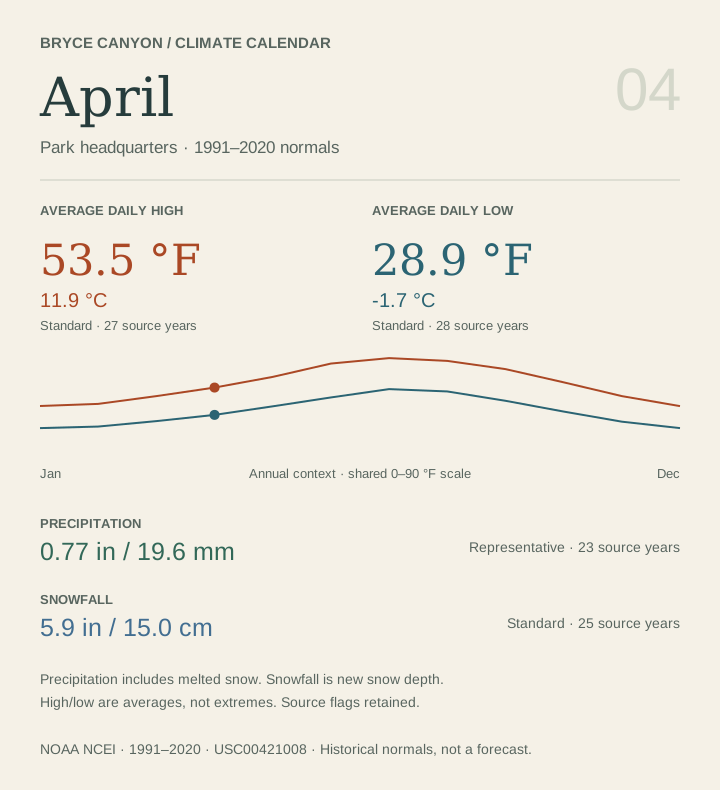
| April | 53.5 °F(11.9 °C)S · 27 yr | 28.9 °F(-1.7 °C)S · 28 yr | 41.2 °F(5.1 °C)S · 27 yr | 0.77 in(19.6 mm)R · 23 yr | 5.9 in(15.0 cm)S · 25 yr |
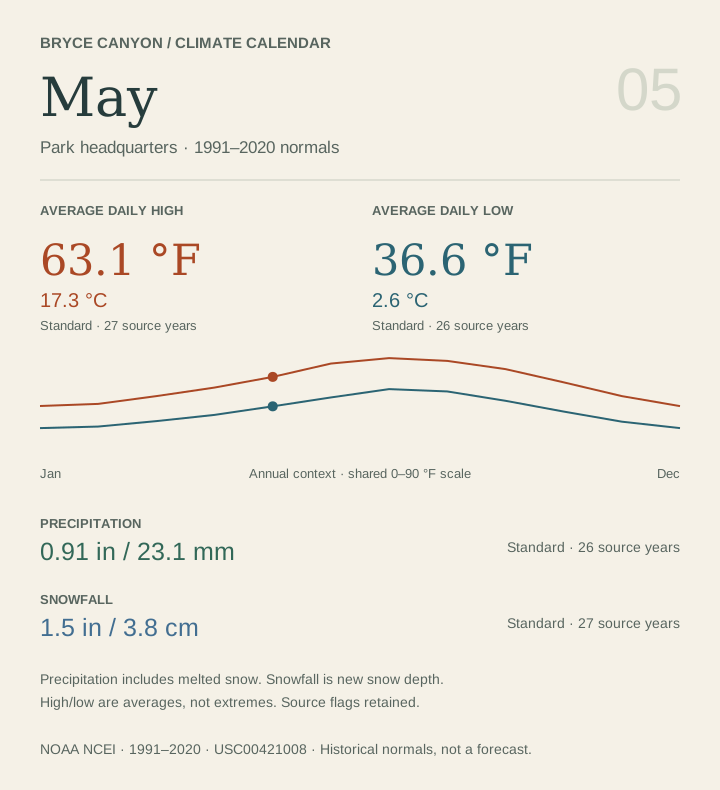
| May | 63.1 °F(17.3 °C)S · 27 yr | 36.6 °F(2.6 °C)S · 26 yr | 49.9 °F(9.9 °C)S · 26 yr | 0.91 in(23.1 mm)S · 26 yr | 1.5 in(3.8 cm)S · 27 yr |
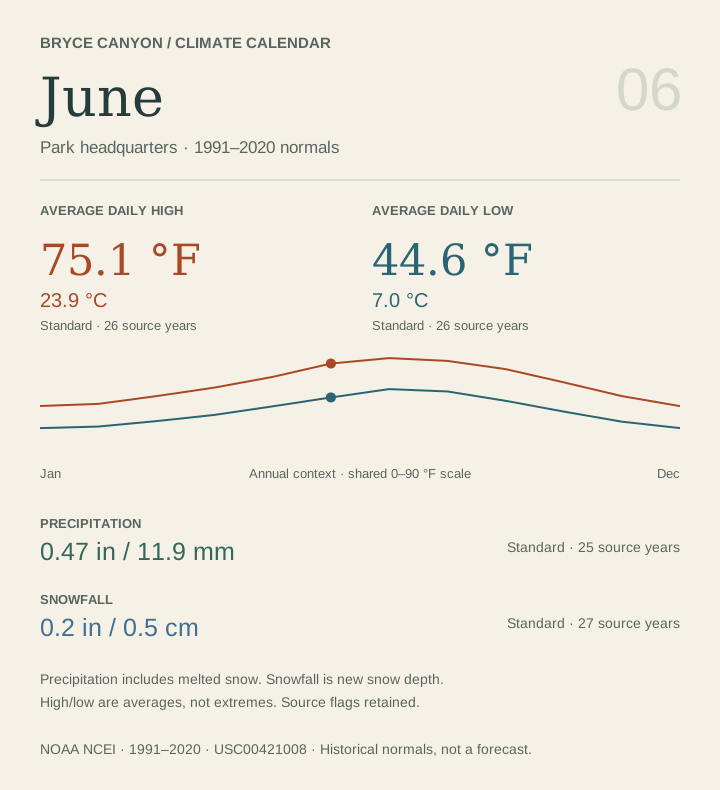
| June | 75.1 °F(23.9 °C)S · 26 yr | 44.6 °F(7.0 °C)S · 26 yr | 59.8 °F(15.4 °C)S · 26 yr | 0.47 in(11.9 mm)S · 25 yr | 0.2 in(0.5 cm)S · 27 yr |
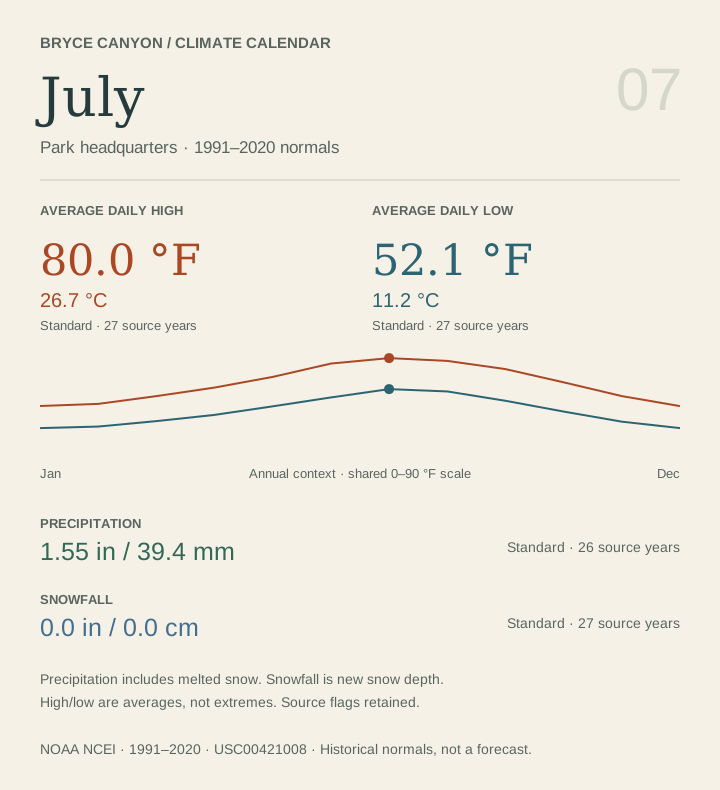
| July | 80.0 °F(26.7 °C)S · 27 yr | 52.1 °F(11.2 °C)S · 27 yr | 66.0 °F(18.9 °C)S · 27 yr | 1.55 in(39.4 mm)S · 26 yr | 0.0 in(0.0 cm)S · 27 yr |
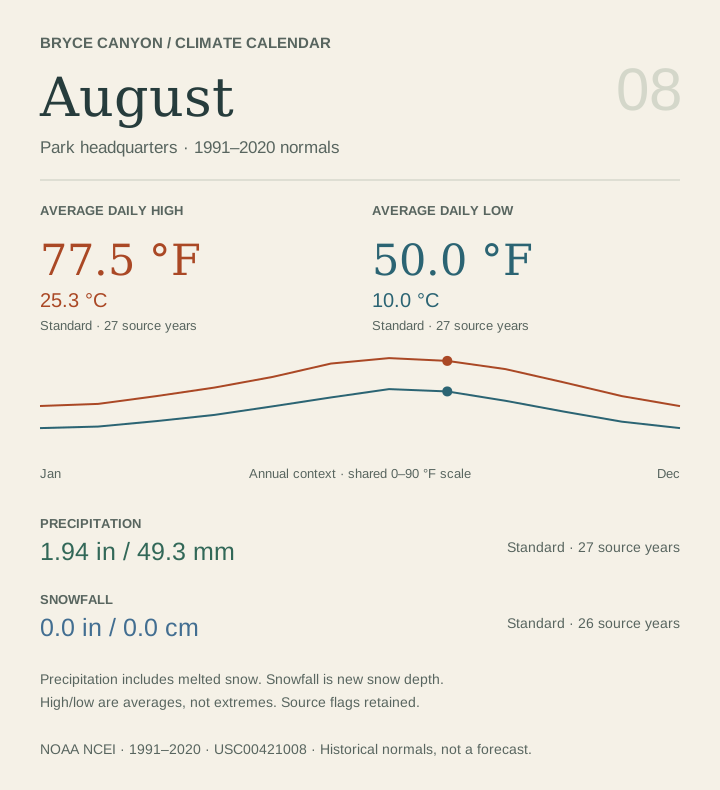
| August | 77.5 °F(25.3 °C)S · 27 yr | 50.0 °F(10.0 °C)S · 27 yr | 63.7 °F(17.6 °C)S · 27 yr | 1.94 in(49.3 mm)S · 27 yr | 0.0 in(0.0 cm)S · 26 yr |
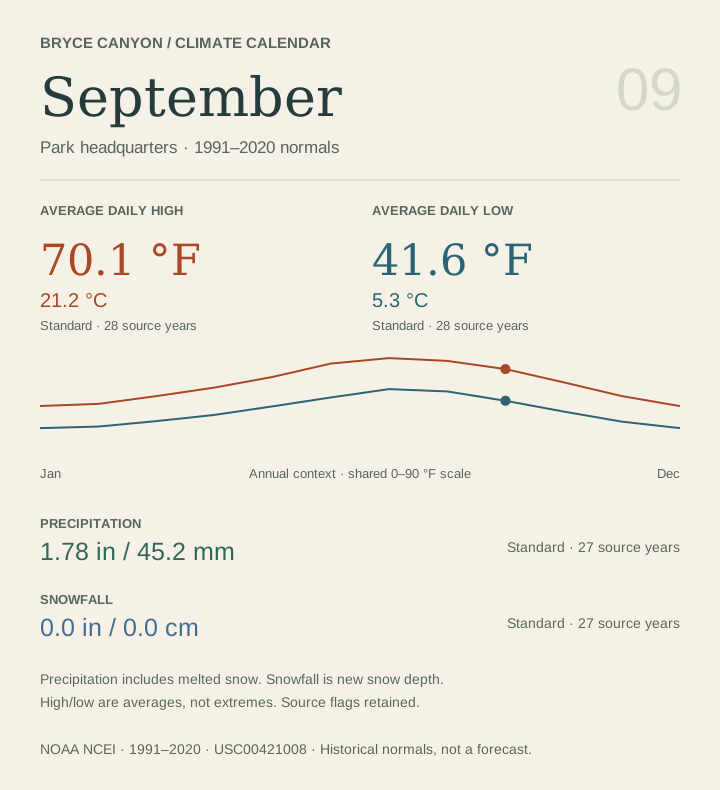
| September | 70.1 °F(21.2 °C)S · 28 yr | 41.6 °F(5.3 °C)S · 28 yr | 55.9 °F(13.3 °C)S · 28 yr | 1.78 in(45.2 mm)S · 27 yr | 0.0 in(0.0 cm)S · 27 yr |
| October | 58.2 °F(14.6 °C)S · 28 yr | 31.9 °F(-0.1 °C)S · 27 yr | 45.0 °F(7.2 °C)S · 27 yr | 1.73 in(43.9 mm)S · 25 yr | 3.0 in(7.6 cm)S · 26 yr |
| November | 45.8 °F(7.7 °C)S · 27 yr | 22.8 °F(-5.1 °C)S · 26 yr | 34.3 °F(1.3 °C)S · 26 yr | 1.28 in(32.5 mm)S · 24 yr | 9.7 in(24.6 cm)P · 21 yr |
| December | 36.8 °F(2.7 °C)S · 27 yr | 17.0 °F(-8.3 °C)S · 27 yr | 26.9 °F(-2.8 °C)S · 27 yr | 1.34 in(34.0 mm)S · 24 yr | 15.3 in(38.9 cm)P · 20 yr |
USW00023159 · 1991–2020 · 2,312.2 m
| Month | Average daily high | Average daily low | Mean temperature | Precipitation | Snowfall |
|---|---|---|---|---|---|
| January | 35.7 °F(2.1 °C)R · 20 yr | 6.1 °F(-14.4 °C)R · 20 yr | 20.9 °F(-6.2 °C)R · 20 yr | 0.69 in(17.5 mm)R · 19 yr | Not availableNot published |
| February | 37.6 °F(3.1 °C)R · 20 yr | 9.7 °F(-12.4 °C)R · 20 yr | 23.7 °F(-4.6 °C)R · 20 yr | 0.77 in(19.6 mm)R · 16 yr | Not availableNot published |
| March | 45.3 °F(7.4 °C)R · 20 yr | 17.8 °F(-7.9 °C)R · 20 yr | 31.6 °F(-0.2 °C)R · 20 yr | 0.85 in(21.6 mm)R · 19 yr | Not availableNot published |
| April | 53.9 °F(12.2 °C)R · 20 yr | 24.2 °F(-4.3 °C)R · 20 yr | 39.0 °F(3.9 °C)R · 20 yr | 0.70 in(17.8 mm)R · 18 yr | Not availableNot published |
| May | 64.3 °F(17.9 °C)R · 20 yr | 30.8 °F(-0.7 °C)R · 20 yr | 47.5 °F(8.6 °C)R · 20 yr | 0.80 in(20.3 mm)R · 19 yr | Not availableNot published |
| June | 76.3 °F(24.6 °C)R · 20 yr | 36.7 °F(2.6 °C)R · 20 yr | 56.5 °F(13.6 °C)R · 20 yr | 0.39 in(9.9 mm)R · 16 yr | Not availableNot published |
| July | 81.4 °F(27.4 °C)R · 20 yr | 45.2 °F(7.3 °C)R · 20 yr | 63.3 °F(17.4 °C)R · 20 yr | 1.35 in(34.3 mm)R · 18 yr | Not availableNot published |
| August | 78.6 °F(25.9 °C)R · 20 yr | 44.6 °F(7.0 °C)R · 20 yr | 61.6 °F(16.4 °C)R · 20 yr | 1.46 in(37.1 mm)R · 20 yr | Not availableNot published |
| September | 71.2 °F(21.8 °C)R · 20 yr | 36.5 °F(2.5 °C)R · 20 yr | 53.9 °F(12.2 °C)R · 20 yr | 1.66 in(42.2 mm)R · 18 yr | Not availableNot published |
| October | 59.2 °F(15.1 °C)R · 20 yr | 26.1 °F(-3.3 °C)R · 20 yr | 42.7 °F(5.9 °C)R · 20 yr | 1.49 in(37.8 mm)R · 19 yr | Not availableNot published |
| November | 45.7 °F(7.6 °C)R · 21 yr | 15.2 °F(-9.3 °C)R · 21 yr | 30.5 °F(-0.8 °C)R · 21 yr | 0.78 in(19.8 mm)R · 17 yr | Not availableNot published |
| December | 35.1 °F(1.7 °C)R · 21 yr | 5.7 °F(-14.6 °C)R · 21 yr | 20.4 °F(-6.4 °C)R · 21 yr | 0.64 in(16.3 mm)R · 17 yr | Not availableNot published |