The illustrated guide below works without interactive graphics.
Explore at your own pace
An illustrated field atlas
The same landscapes and learning points, with still images, sections, a map, and a trail profile. No interactive graphics are needed.
The plateau and the amphitheater
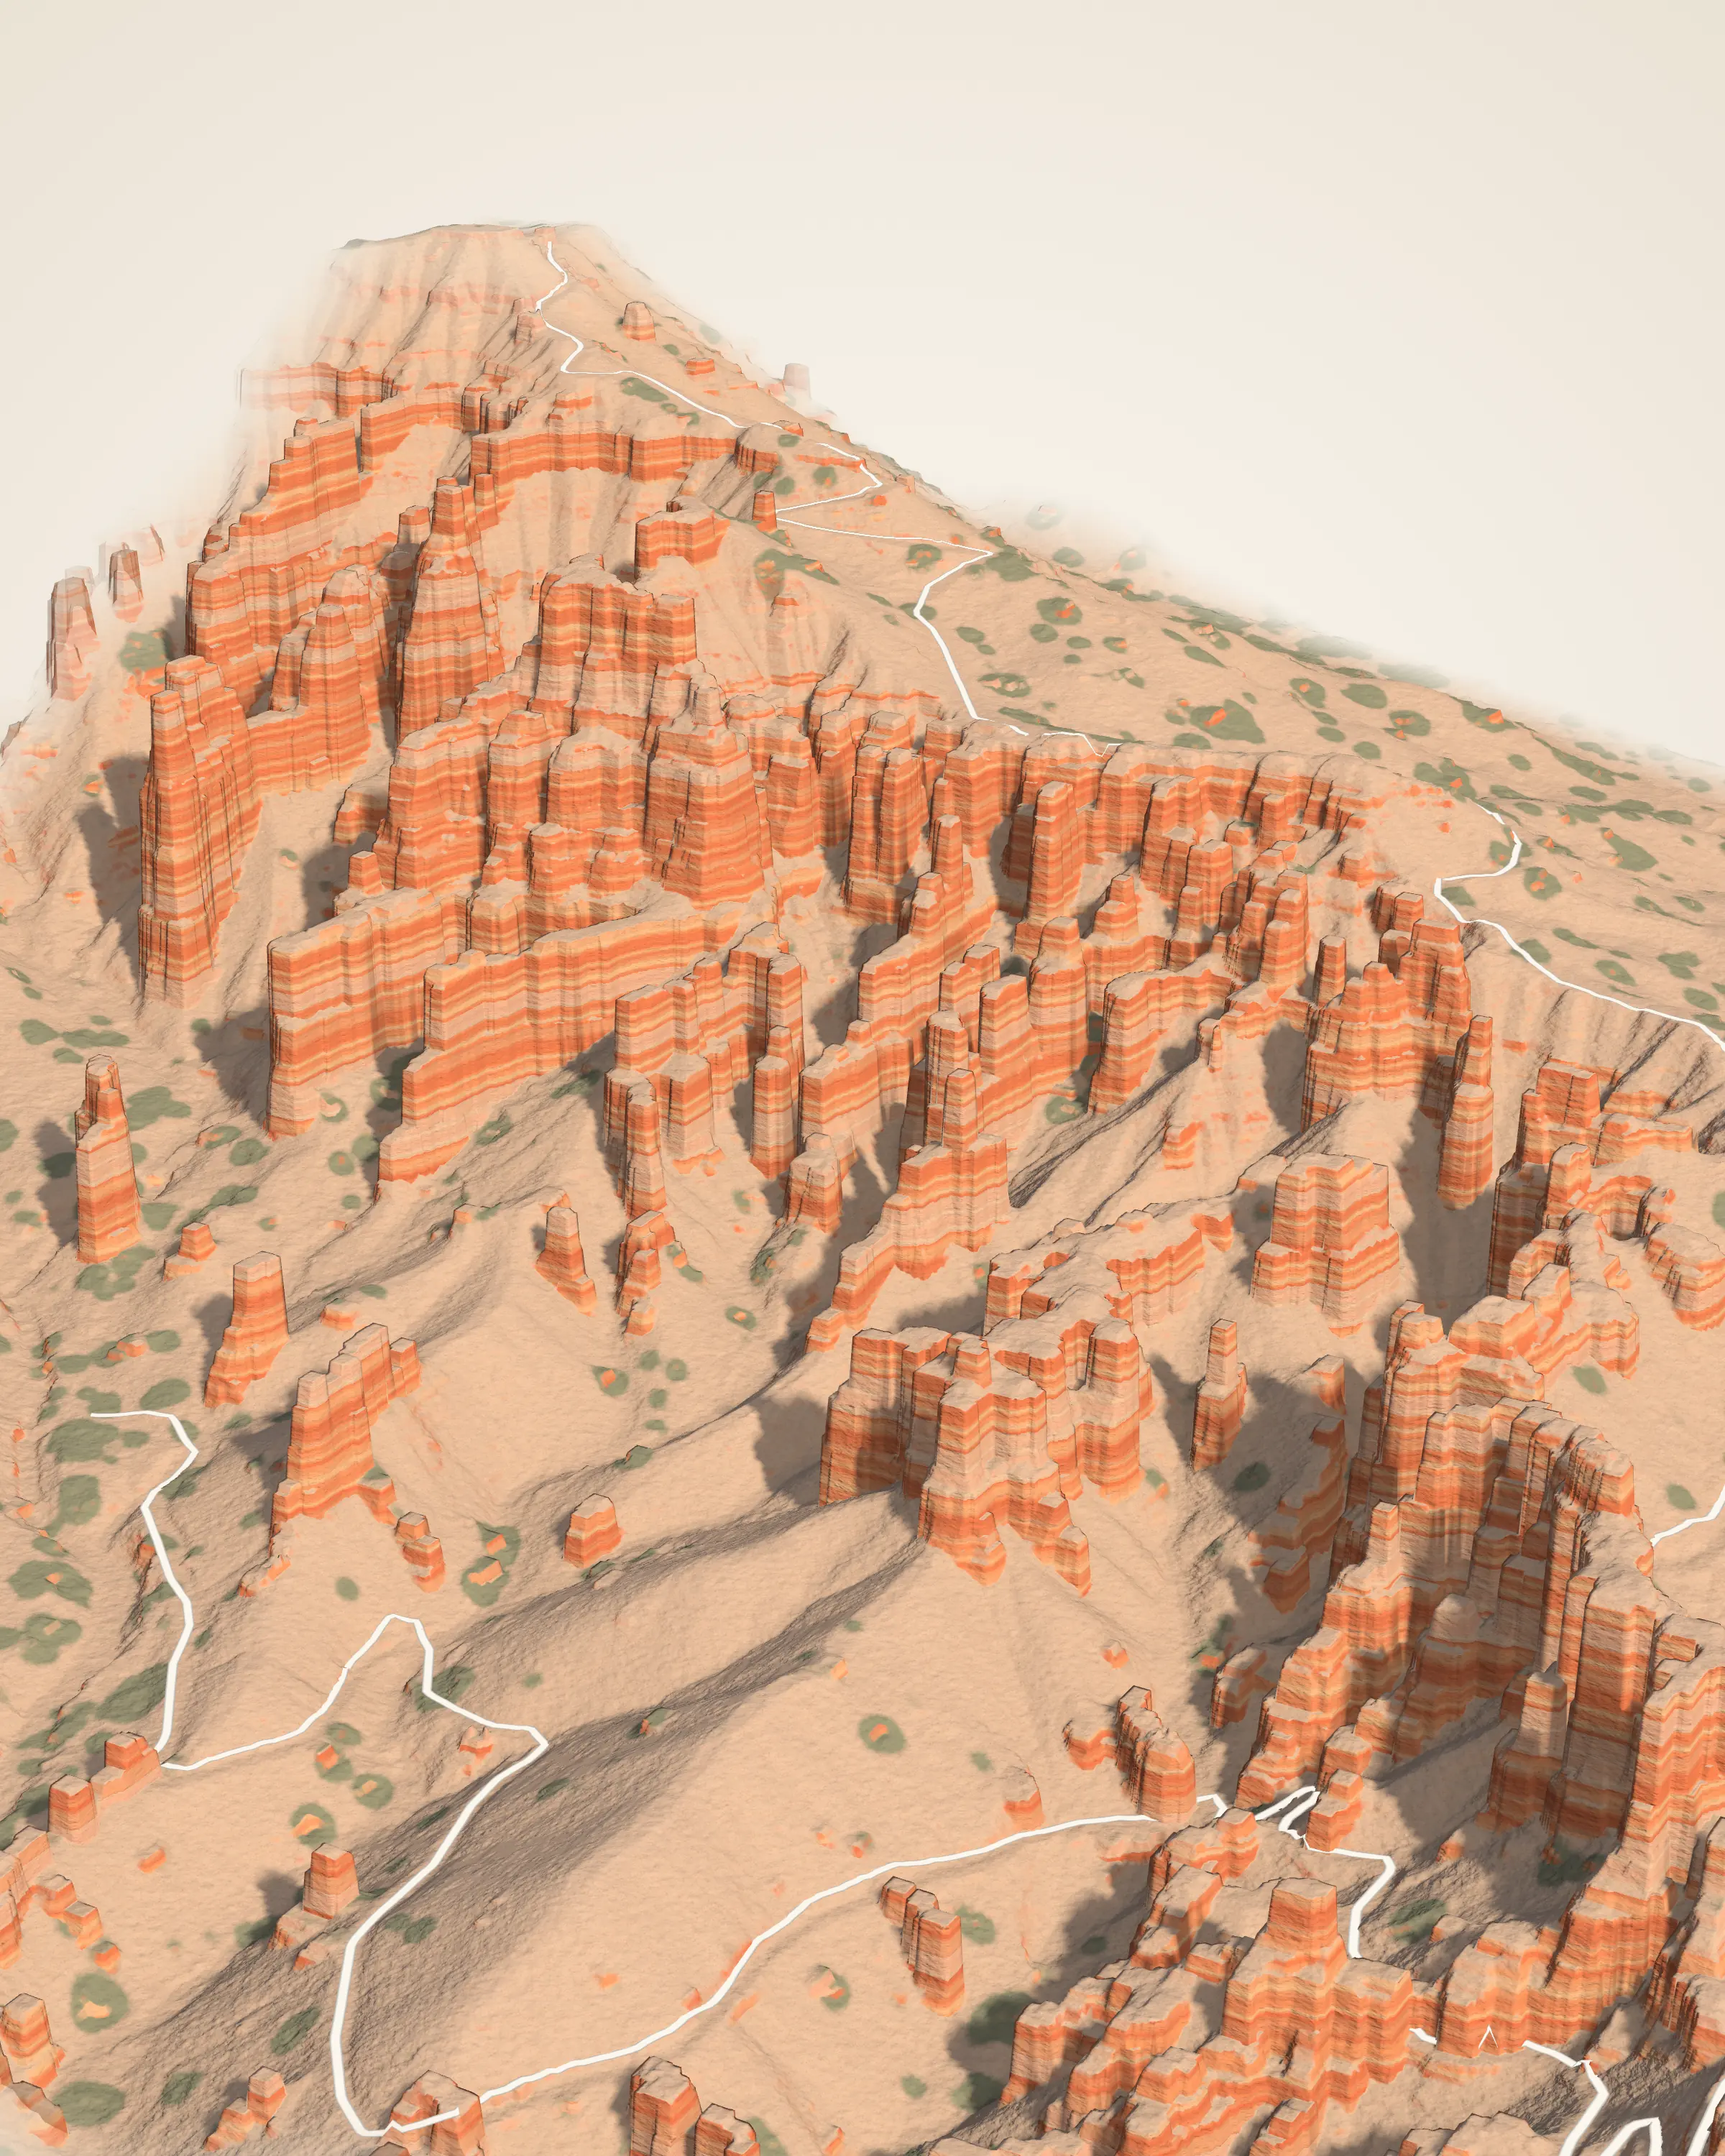
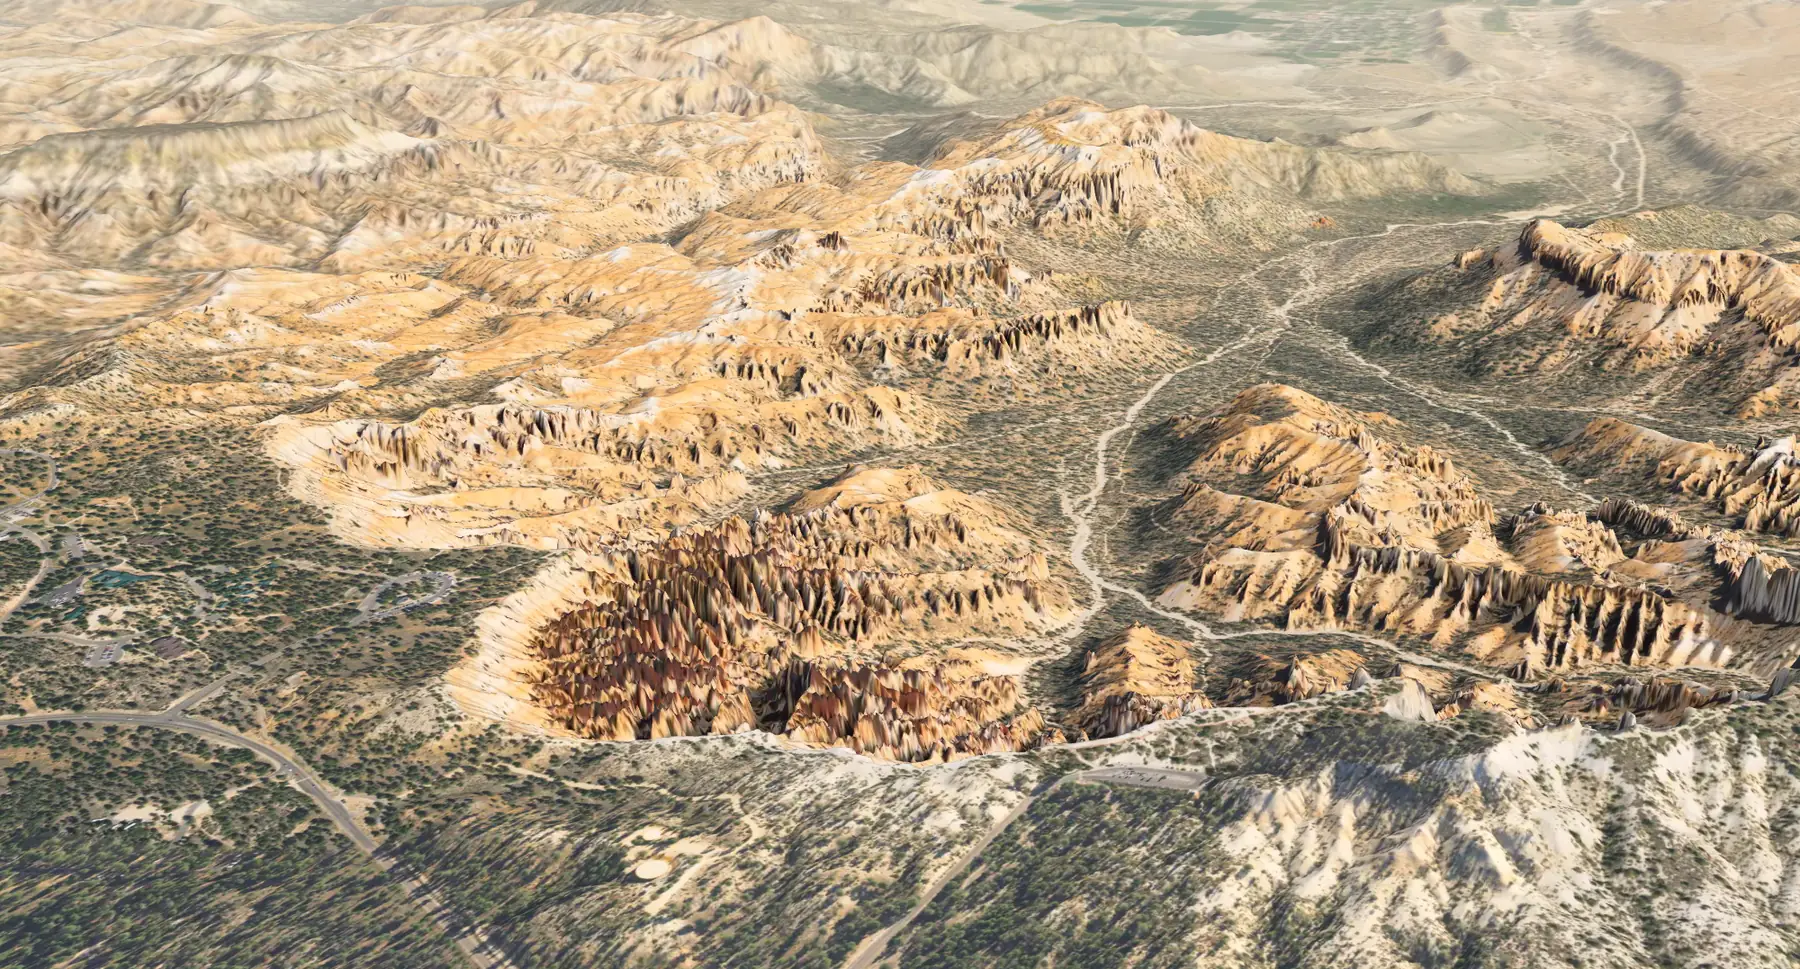
The 30 km model relates a forested plateau to its retreating rim, the hoodoos below, and the drainage network. Height colors in the Elevation view represent elevation, not mapped rock units. The rock has an older history than the forms carved into it.
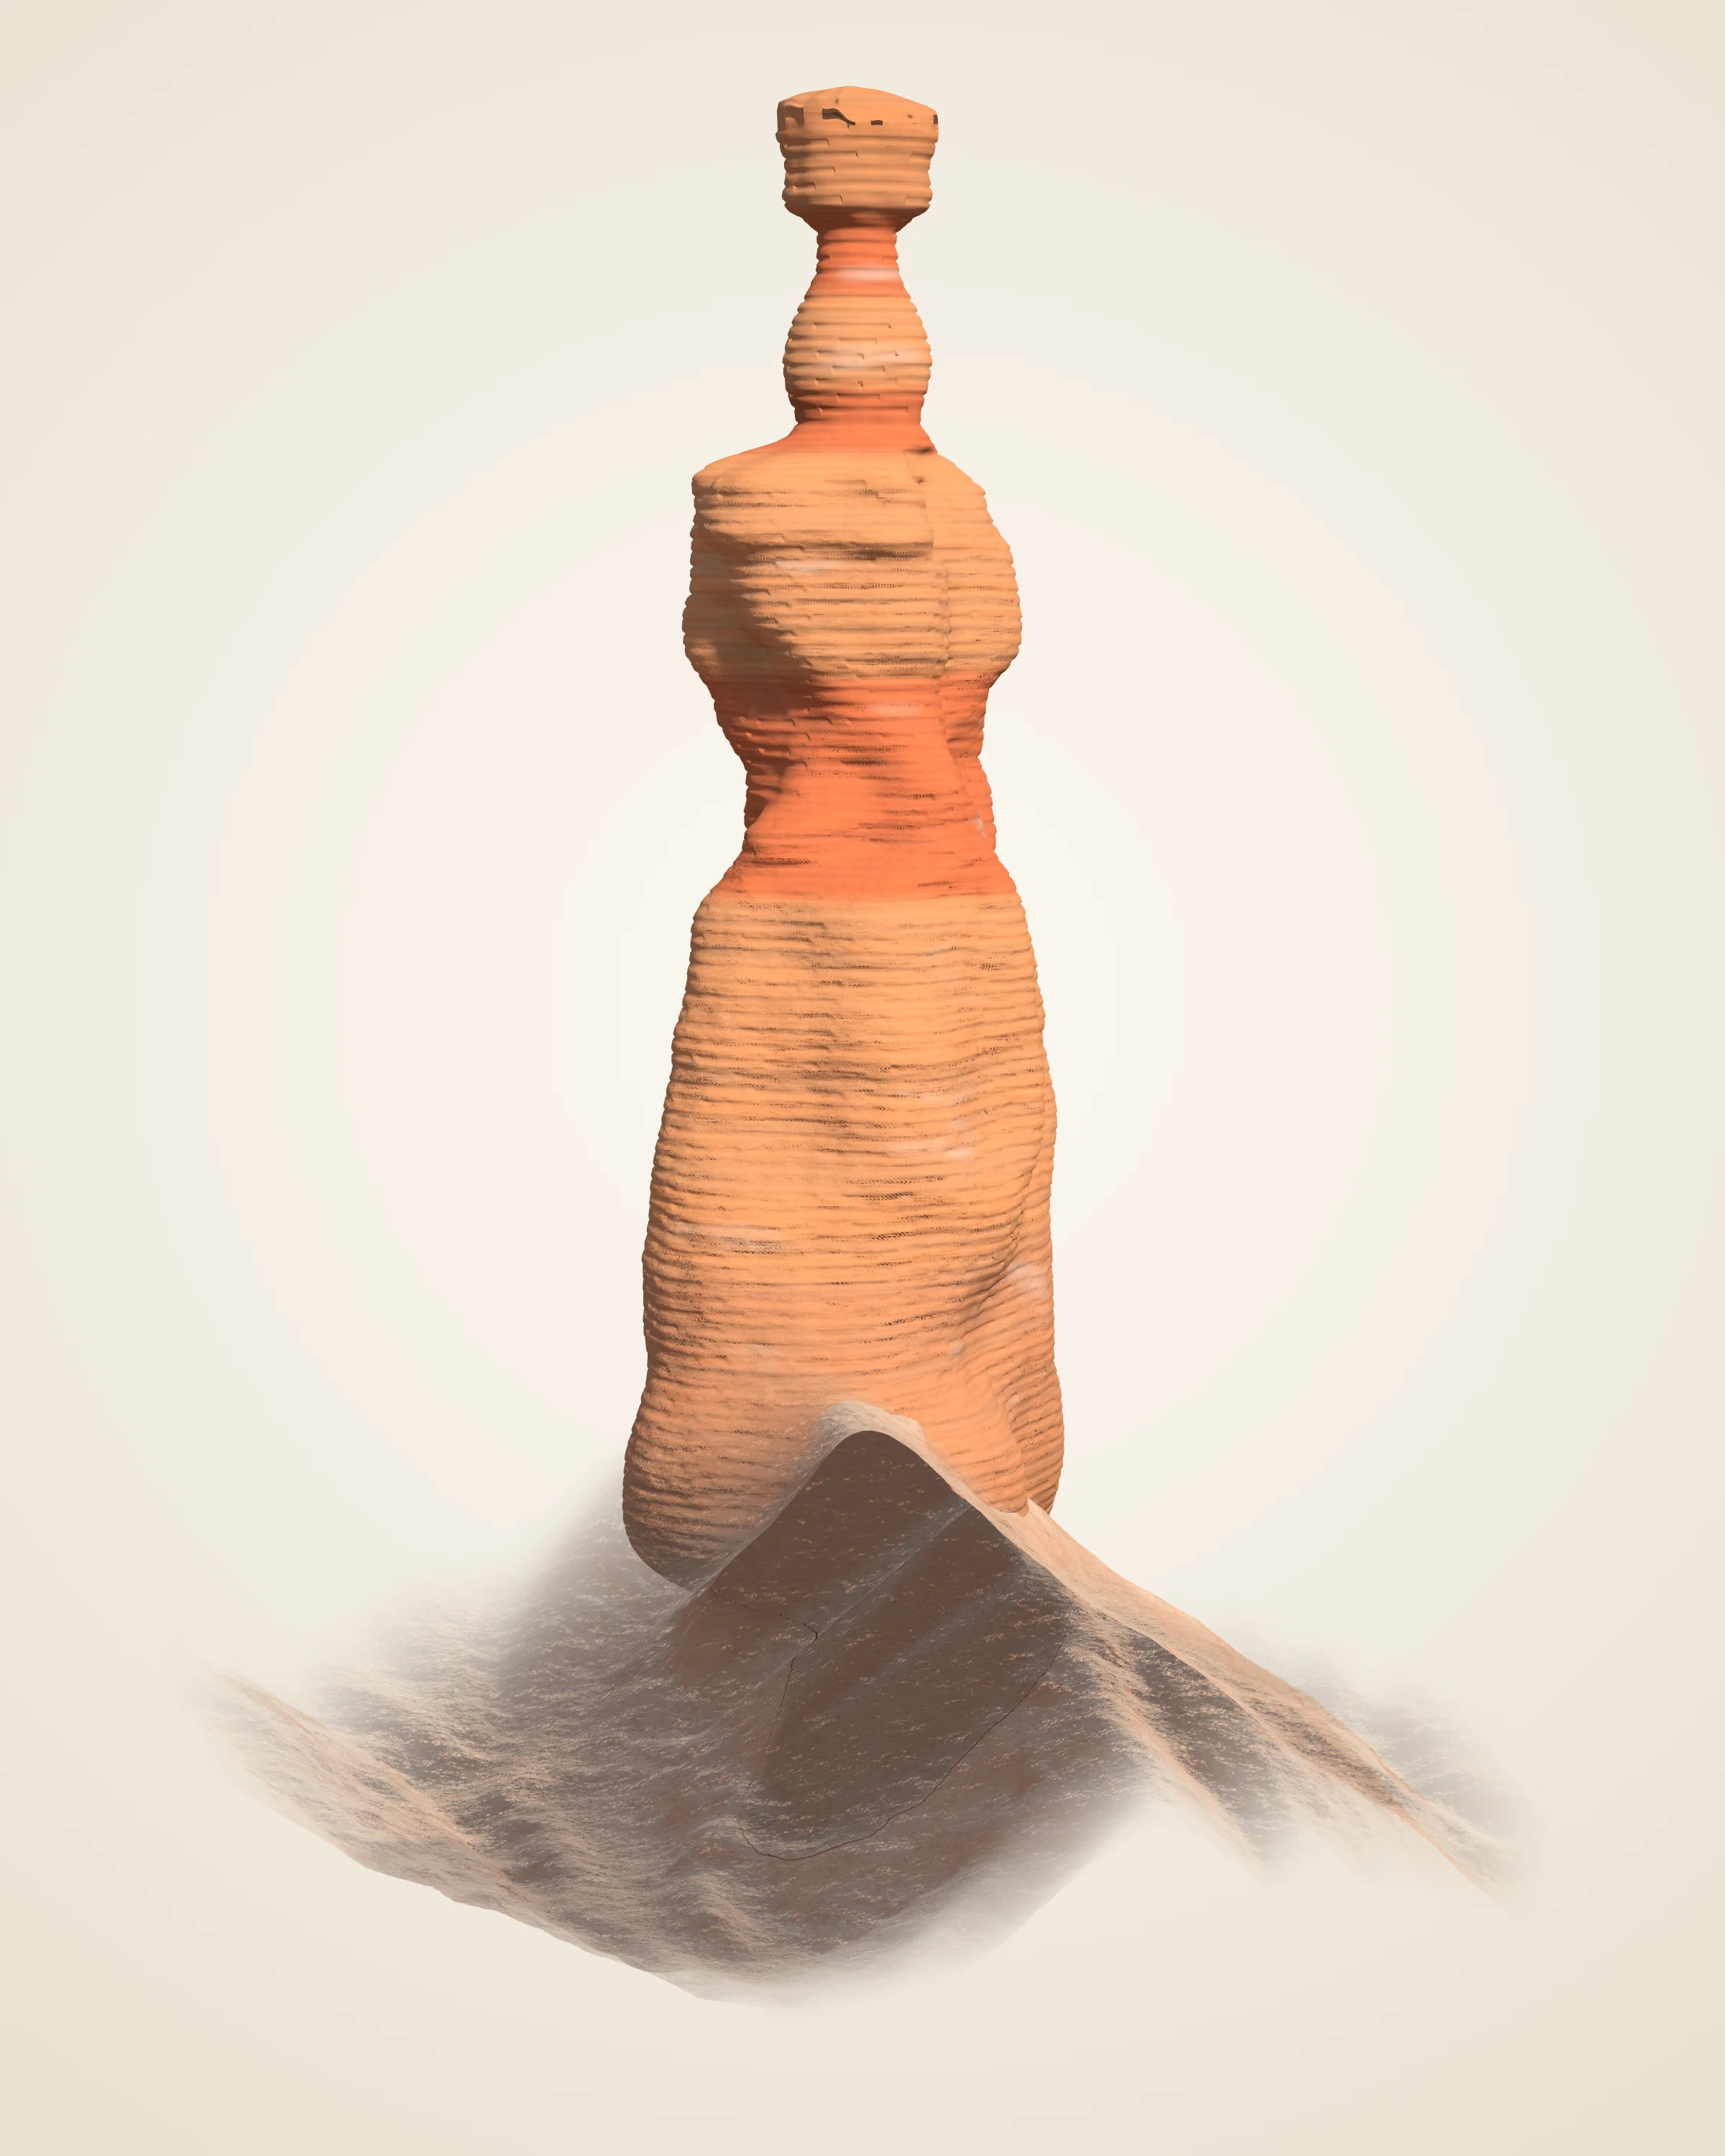
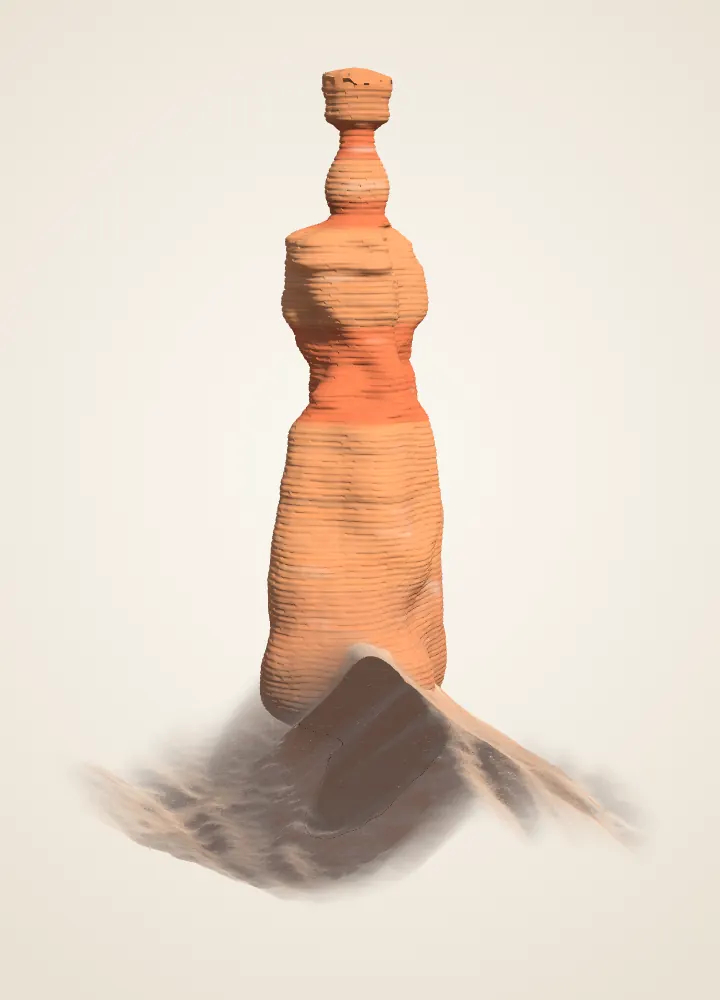
About 28 m tall above its uphill foot; top elevation about 2,401 m in the lidar. Ledges and waists suggest different resistance. The neck is interpreted from a photograph; the section’s beds have not been sampled. Method and credits.
Derived Cross-section along the line from Sunset Point, true scale. Outline and ground: USGS 3DEP lidar (2018) and the 1 m USGS elevation model; neck traced from an NPS photograph. Beds are read from where the outline juts out or pinches in; they are assumed flat-lying beyond the pillar, and no rock was sampled.
Measurements, modes and source limits
Top
2,401 m 7,878 ft
Height
About 28 m 90 ft above its uphill foot, 140 ft on the downhill side
Cap
About 3 m across on a neck about 1.3 m (4 ft) wide
Measured
About 3,500 laser returns on the pillar
Shape from USGS 3DEP lidar, 2018; the aircraft could not see under the cap, so the neck is traced from an NPS photograph taken from the west. Ground from the same lidar, trees left out. Colours and fine texture are drawn, not measured.
Cut along the line from Sunset Point. Pale bands are harder beds, where the pillar juts out; red bands are softer beds, where it pinches in. The beds follow the measured outline; no rock was sampled.
Each dot is one laser return from the 2018 USGS flight: rust on the pillar, grey on the ground, green on trees and small mounds. The aircraft saw the tops of ledges best and almost nothing under the cap.
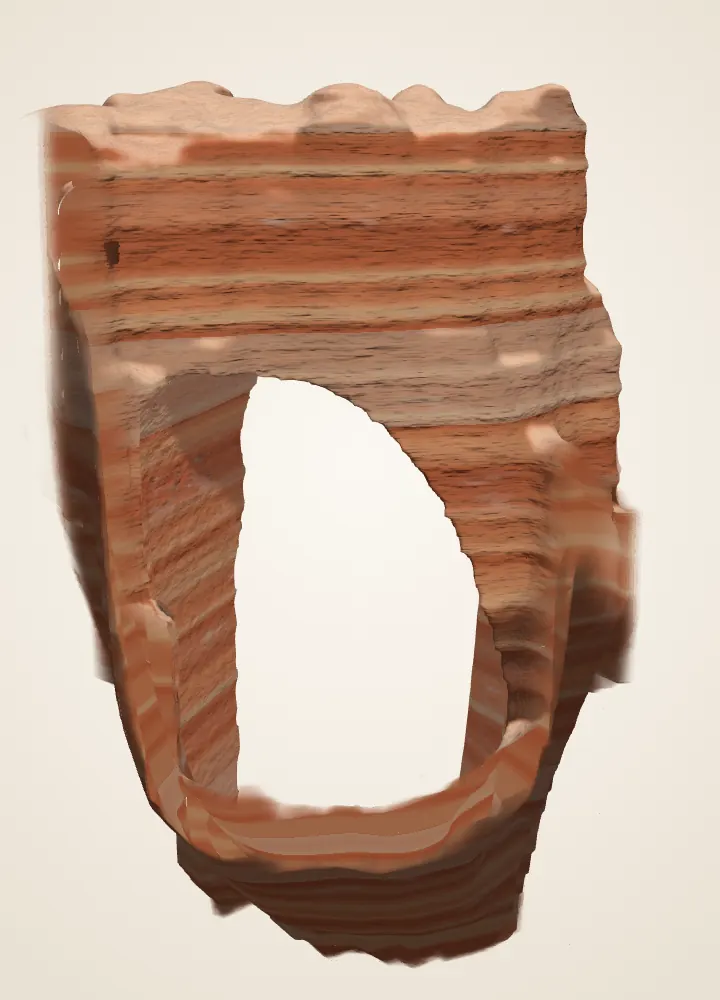
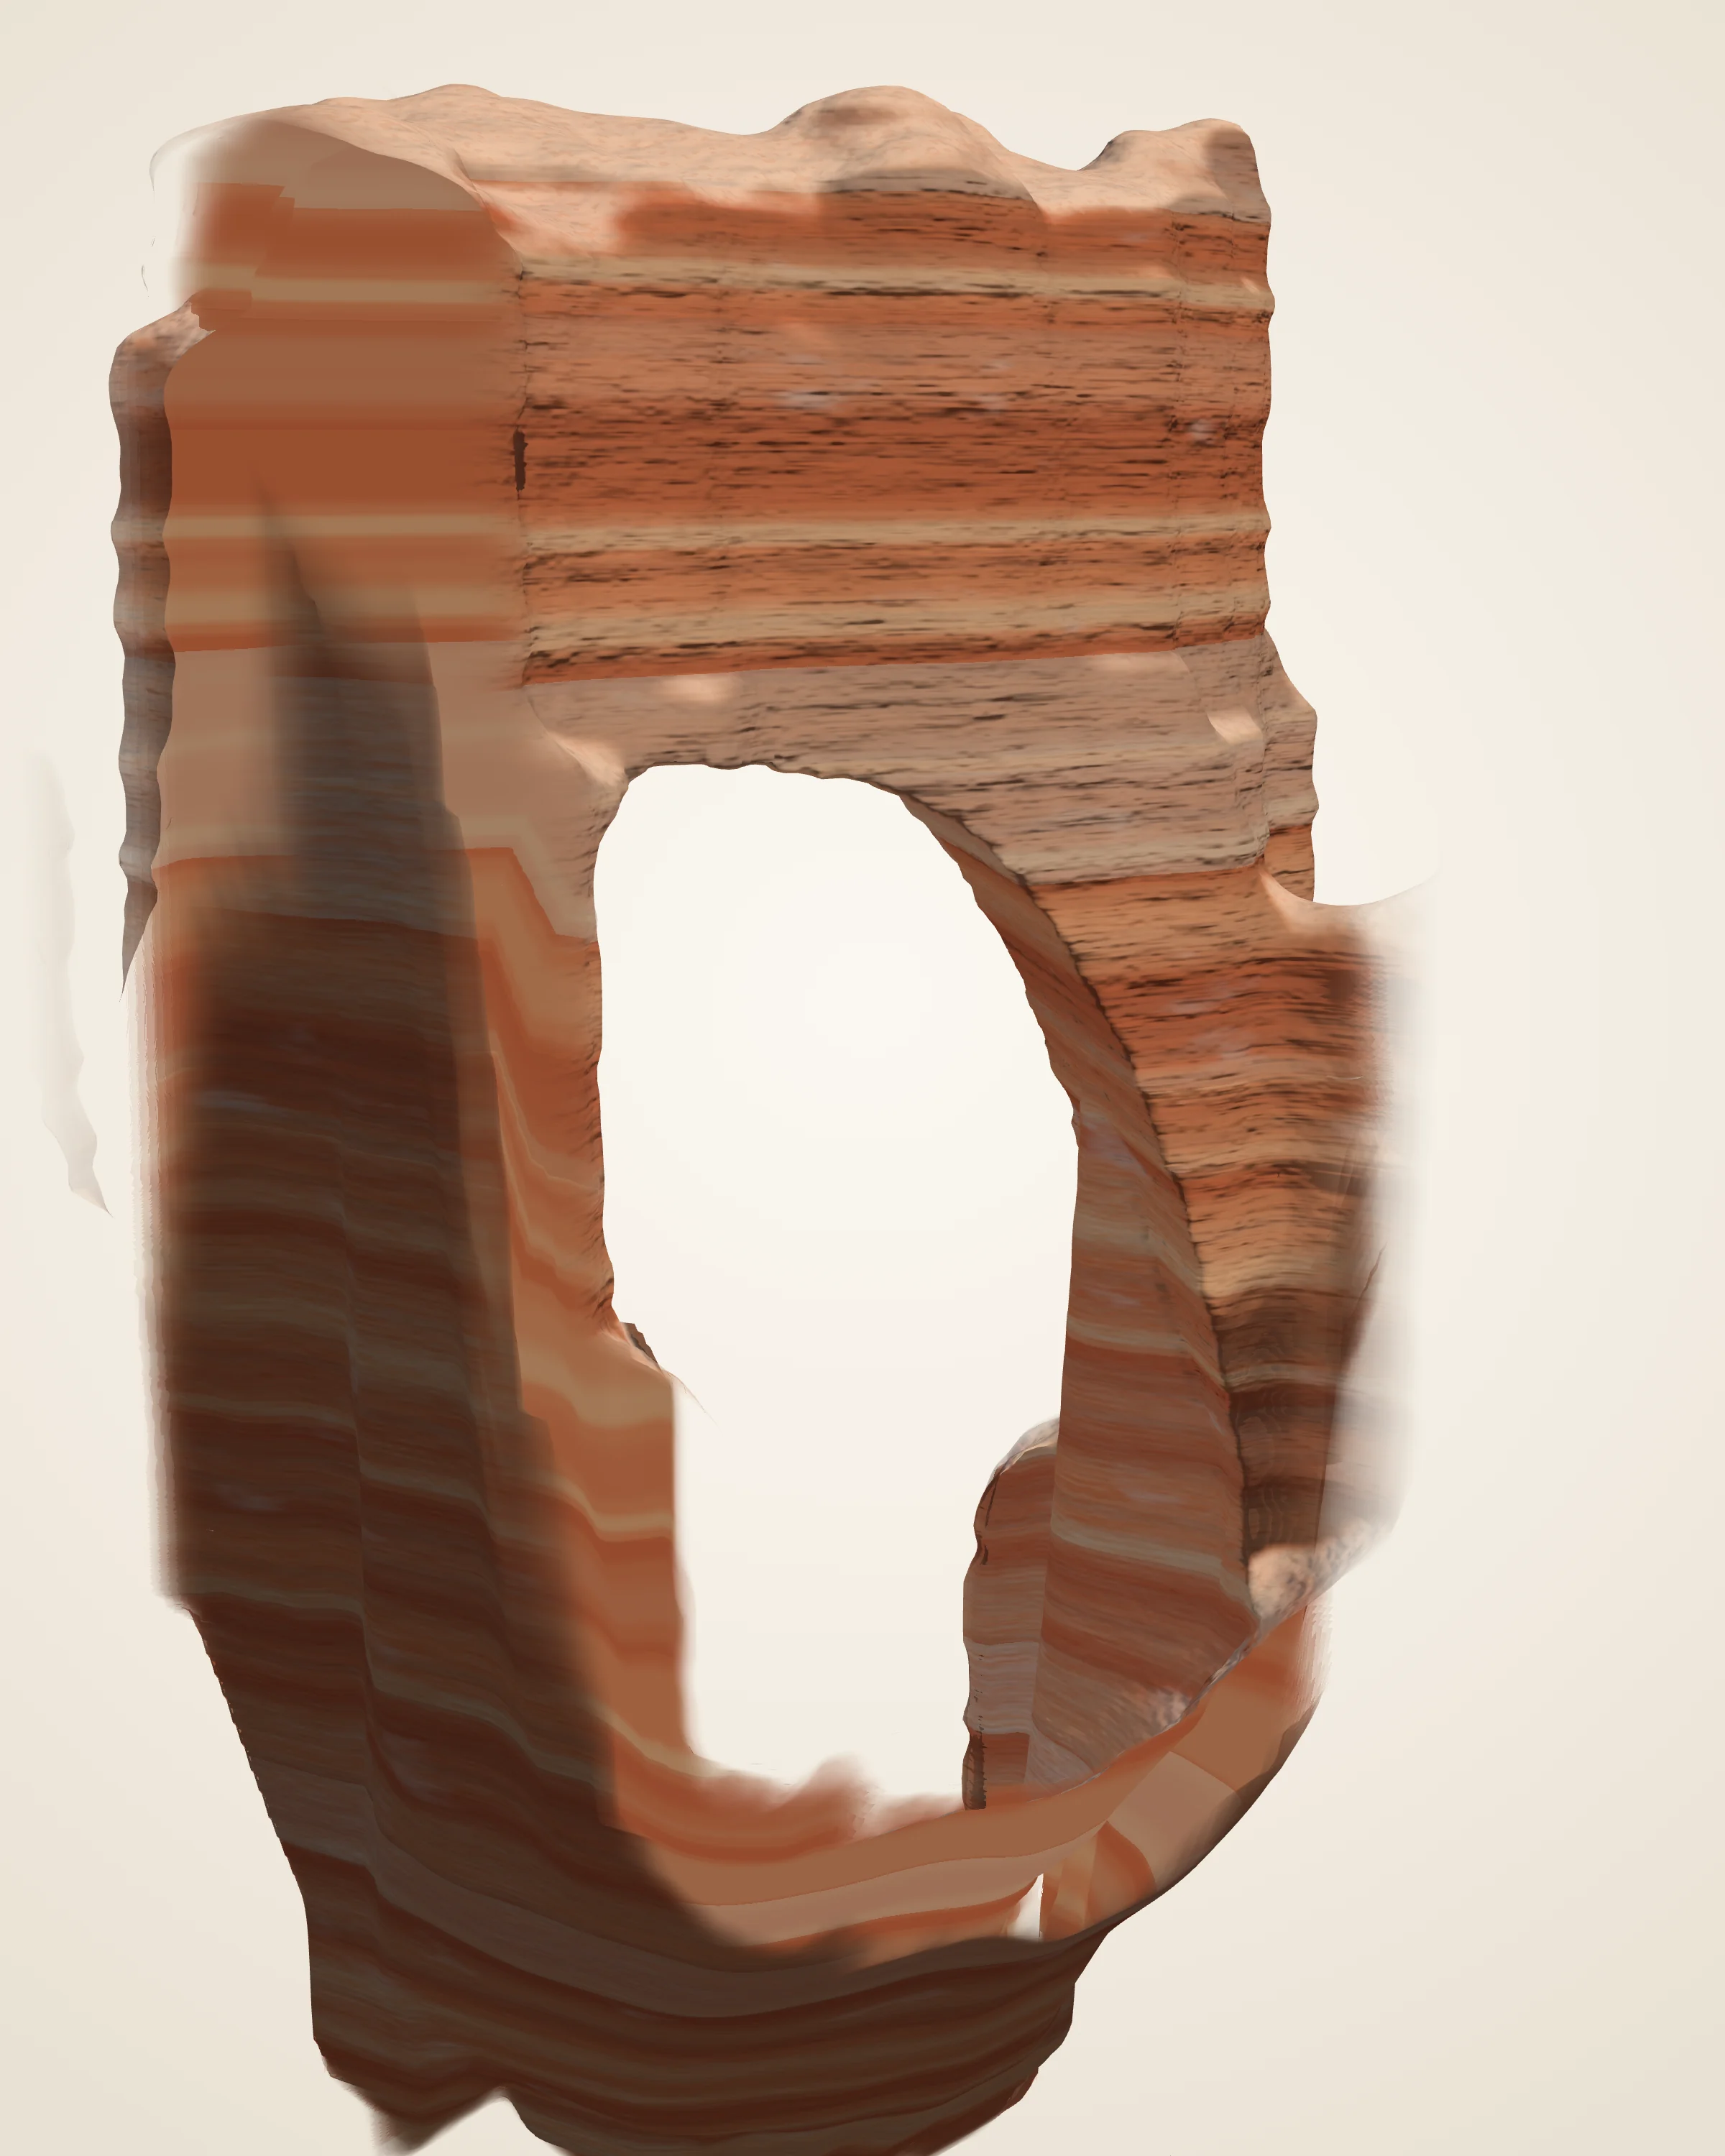
An arch in a rock wall, with an opening about 33 m tall in the model. The illustration follows a fin, an opening, and the possible loss of the span. It does not establish the arch’s past shapes or predict when it will fall. Method and credits.
Derived Face on along the opening, true scale. Top of the rock and the ground: USGS 3DEP lidar (2018); the opening from the USGS photograph (2014) and the laser’s paths under the span, carried straight through the rock. Bands are drawn, not sampled. Bridge or arch: after the Park Service, “Bridges are carved by flowing water, whereas arches can be carved by everything else except flowing water.” Not to scale.
About 33 m tall 109 ft from the ground beneath to the underside of the span; about 19 m wide halfway up
Span
85 ft 26 m across, the Park Service’s figure; about 16 m of rock over the opening
Measured
About 14,000 laser returns on the span
Top of the rock from USGS 3DEP lidar, 2018. The aircraft could not see under the span, so the opening is traced from a USGS photograph taken at the overlook, where the laser’s slanted paths agree with it, and carried straight through the rock. Trees left out. Colours and fine texture are drawn, not measured.
A fin. The window began in a solid wall. Water seeps into cracks and freezes at night; ice takes up almost 10 percent more room than water, and forces the cracks wider.
A window opens. Rainwater dissolves the rock at the top and sides of the wall, and gravity pulls loose the weakened pockets at the center, opening the hole.
Today. The arch looks solid and enduring, but weather is constantly chipping away at the opening.
When the span falls. A window that grows too large to hold up its roof collapses, and a leg left standing becomes a hoodoo. The Park Service says this one may last hundreds or thousands of years, or could collapse tomorrow.
Stages follow the Park Service’s account, drawn by shrinking or raising today’s opening. They are not dated shapes or a forecast.
Each dot is one laser return from the 2018 USGS flight: rust on the fin, grey on the slopes, green on trees. Slanted pulses reached under the span from both sides; none could see its underside.
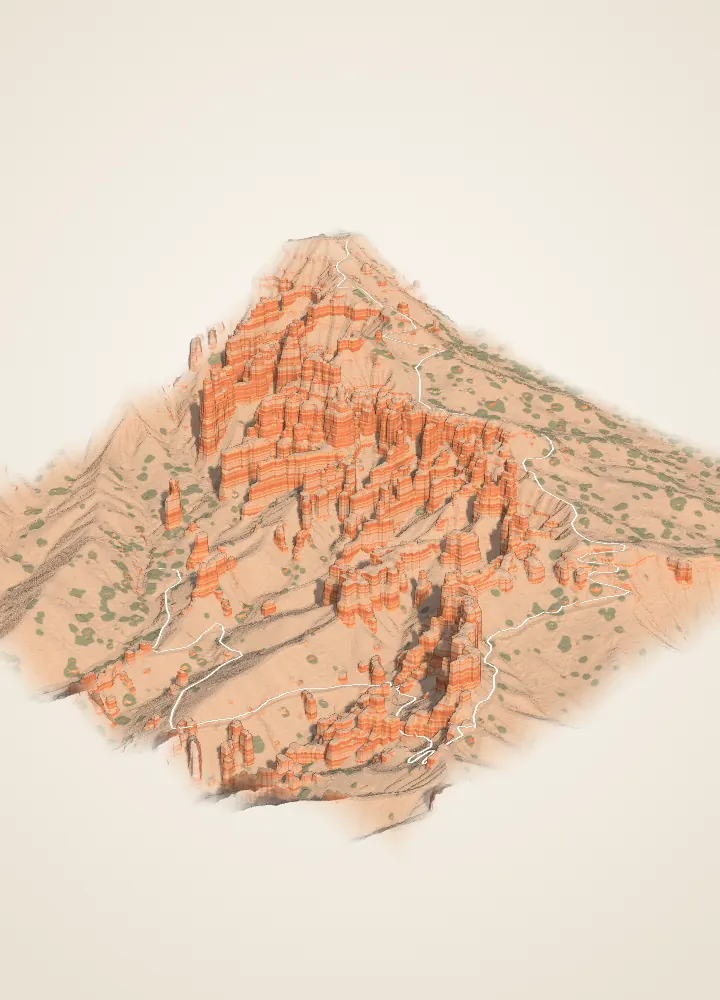
The model is a height surface about 432 m across; it does not capture overhangs. The trail begins beyond the block at Sunrise Point. Heights along the OSM line give about 113 m of net descent and about 140 m of climbing on the return, counting every rise. These are model estimates, not a navigation survey. Method and credits.
1.8 mi round trip 2.9 km, the Park Service’s figure; 1.4 km each way on the mapped trail
Down
About 113 m 370 ft from the trailhead at Sunrise Point to Queen Victoria
The climb back
About 140 m 460 ft of climbing on the return, counting every rise; the Park Service lists 450 ft
Measured
About 6.5 million laser returns in the model
Rock and ground from USGS 3DEP lidar, 2018, every 40 cm, with the trees left out; green marks where the laser found tree crowns. The trail is OpenStreetMap’s, set on the lidar ground. Colours and fine texture are drawn, not measured.
The hiker follows the mapped trail from the Sunrise Point trailhead to the Queen Victoria viewpoint, 1.4 km; heights come from the lidar ground under the path. Drag to look around while you walk. Where the line meets rock overhead, the path passes beneath it in the model; positions are as mapped and may be off by a few metres.
Each dot is one laser return from the 2018 USGS flight, a sample of 60,000 of the 6.5 million in the model: rust on rock and other surfaces, grey on the ground, green on trees.
Source elevations are from the 2018 USGS lidar surface. These model views are educational references, not trail directions.
1 / 6 · The rim
Paunsaugunt Plateau
Ponderosa forest covers a nearly flat surface that ends abruptly at the rim. Rain and melting snow erode this edge one to four feet every century, so the amphitheater keeps working its way back into the plateau.
Every stage is visible from here. The rim erodes back into walls, called fins. Ice widens cracks until windows open through them. When a window’s top falls, the pillars left standing are hoodoos. The Queen’s Garden Trail starts here. Walk it in 3D
Thor’s Hammer stands almost directly below (see it in 3D). The rock is mostly limestone, laid down about 50 million years ago in a large freshwater lake that geologists call Lake Claron. Iron oxides make the vivid colors; manganese oxides add patches of pink and purple.
These cliffs belong to the Claron Formation. Its lower Pink Member is a “dirty” limestone with sand, silt and iron, which gives the red. The upper White Member is a purer freshwater limestone. To the north, the dense walls of Silent City fill the view.
The southern end of the amphitheater looks north along its full length, past the Wall of Windows near Inspiration Point to Silent City beside Sunset Point. In Southern Paiute oral tradition, as the park retells it, the hoodoos are Legend People turned to stone by Coyote.
The amphitheater’s drainages gather into Bryce Creek, usually a dry wash that runs only after summer rain or snowmelt. No river cut this bowl, which is why the park calls it an amphitheater, not a canyon.
Lidar elevation here · 2,188 m · 345 m below Inspiration Point
Forest gives way to an abrupt rim, then to slopes and hoodoos. The landscape model covers 30 km; the finer landmark models reveal much smaller features.
Follow the hiker toward Queen Victoria. Compare the map and profile below: the return climbs more than the simple difference between the two endpoints.
The sedimentary rock formed long before these columns were exposed. Follow Deep Time from ancient environments back to the landscape you have explored.
These are educational models. Stay on established trails and respect barriers; neither a model nor a photograph establishes rock stability. Look closely, leave carefully.
Places
Every place has its own page.
Twenty-three places from Mossy Cave to Riggs Spring, each with its photograph, terrain, canyon section, early photographs, best light, walks and sources.
Ten lessons connect contour spacing, sections, slope and vertical exaggeration. A small USGS-derived Bryce grid is kept separate from five analytic teaching surfaces.

 Derived