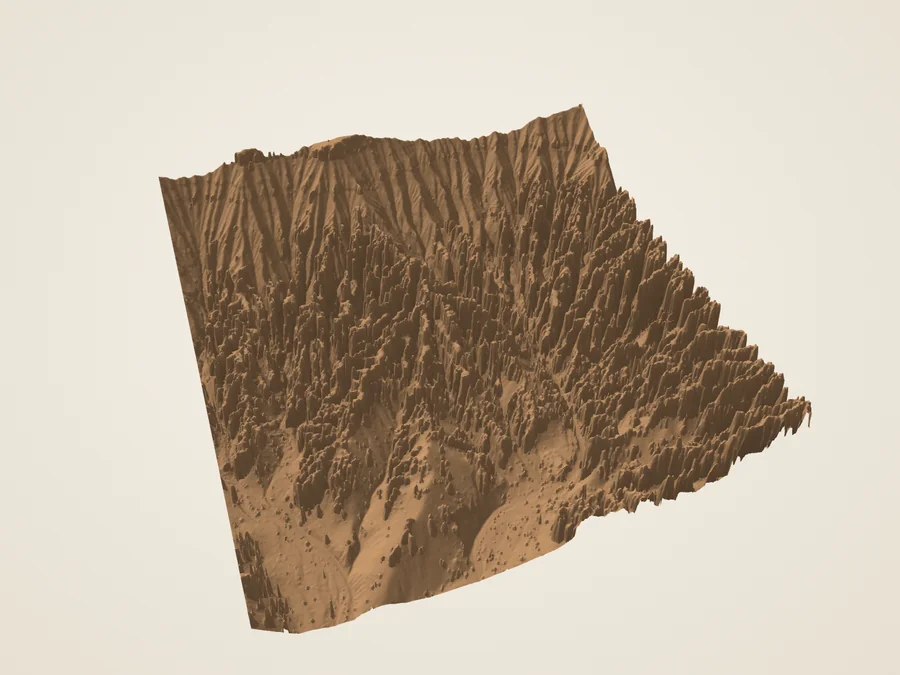
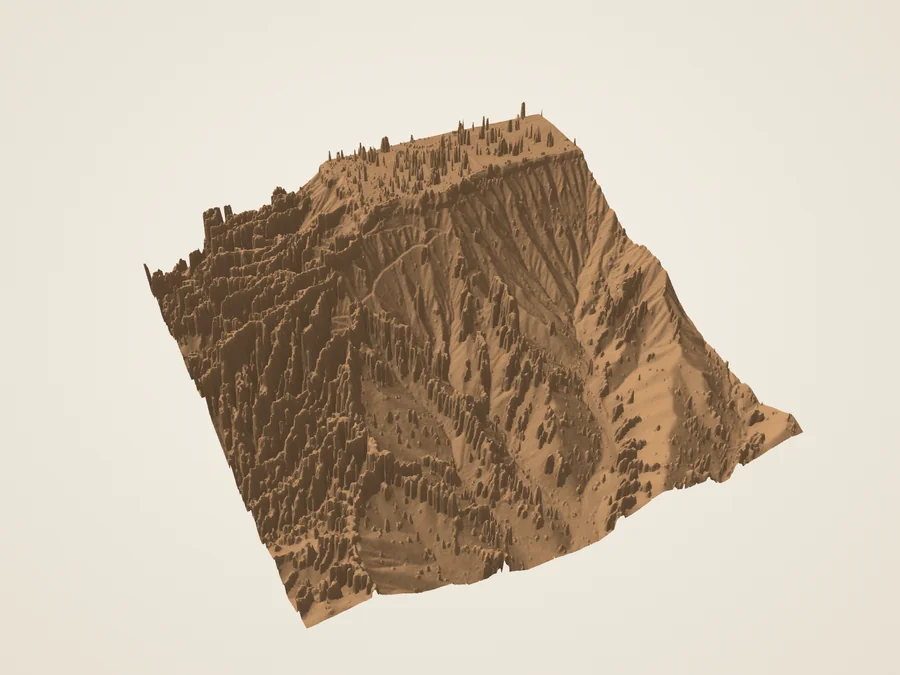
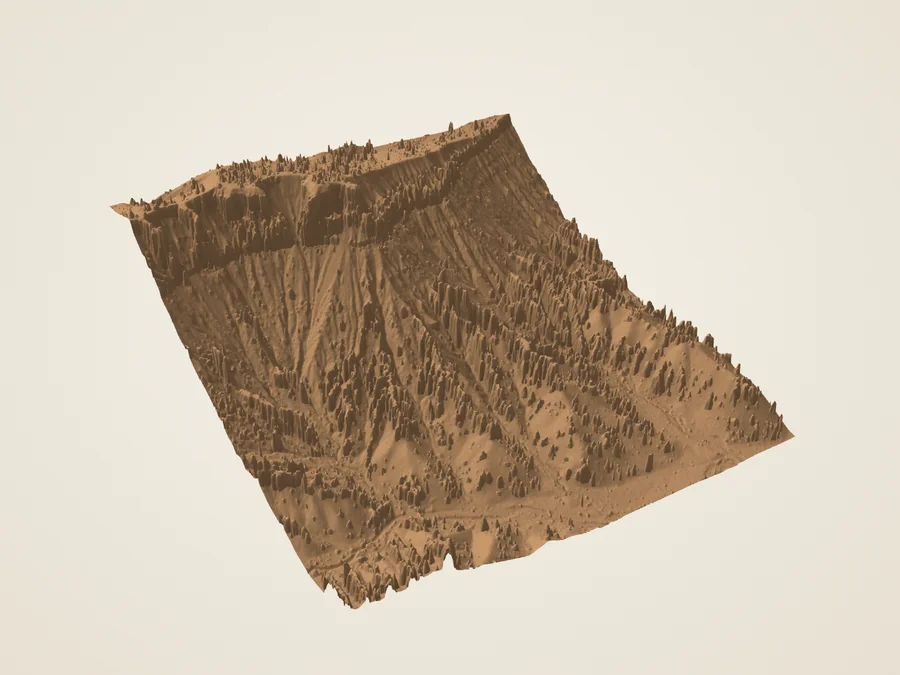
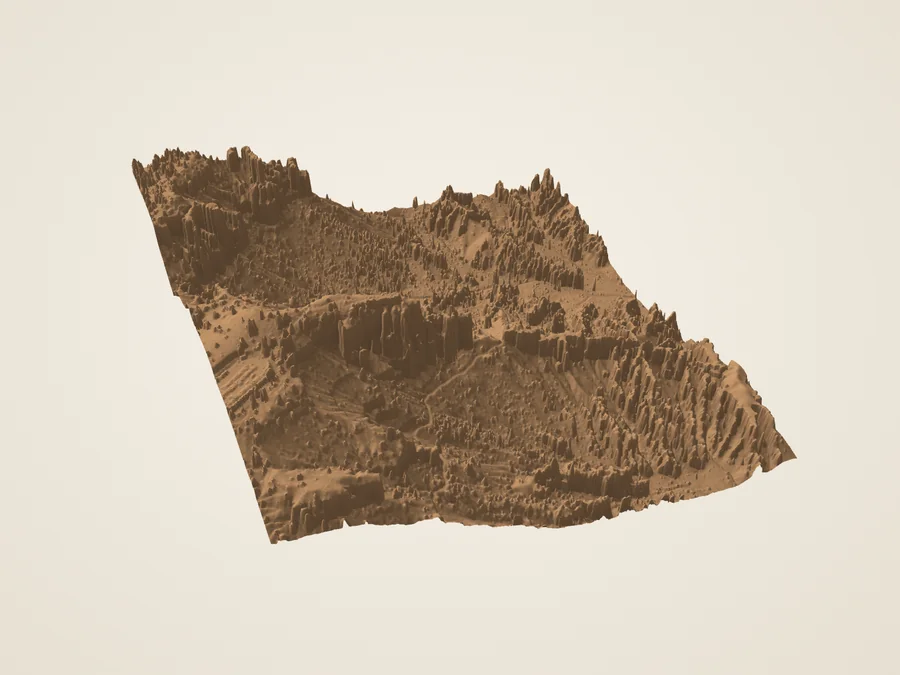
Read the landscape in three dimensions. Measured returns, aerial color, and the limits between them.
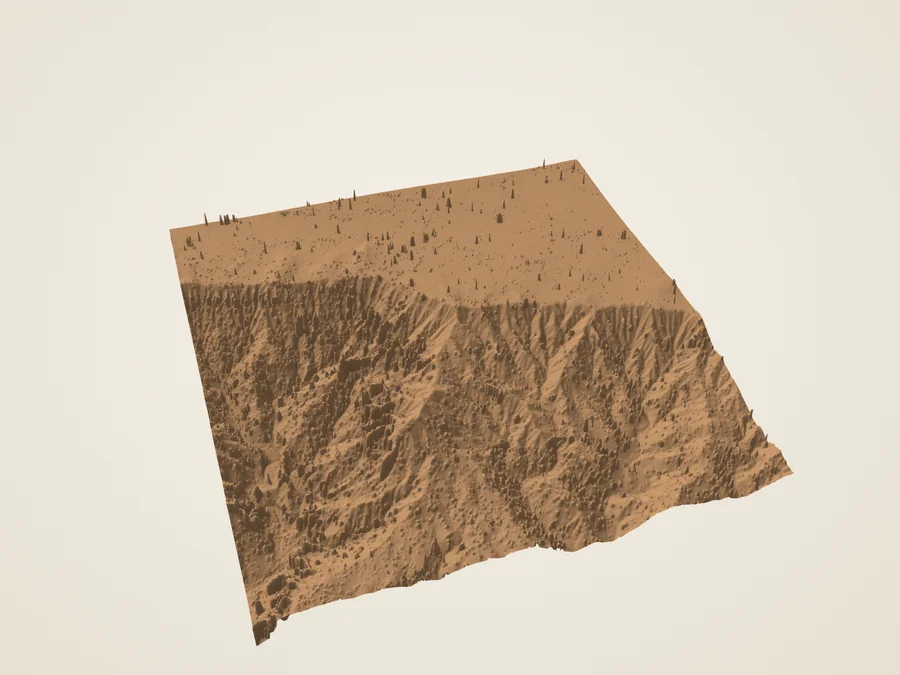
Wall Street320 m crop · 1× vertical scale
N
Static studies below are always available.
Drag sideways to orbit. Arrow keys turn and tilt; + / − zoom; Home resets. Vertical swipes and the scroll wheel move the page.
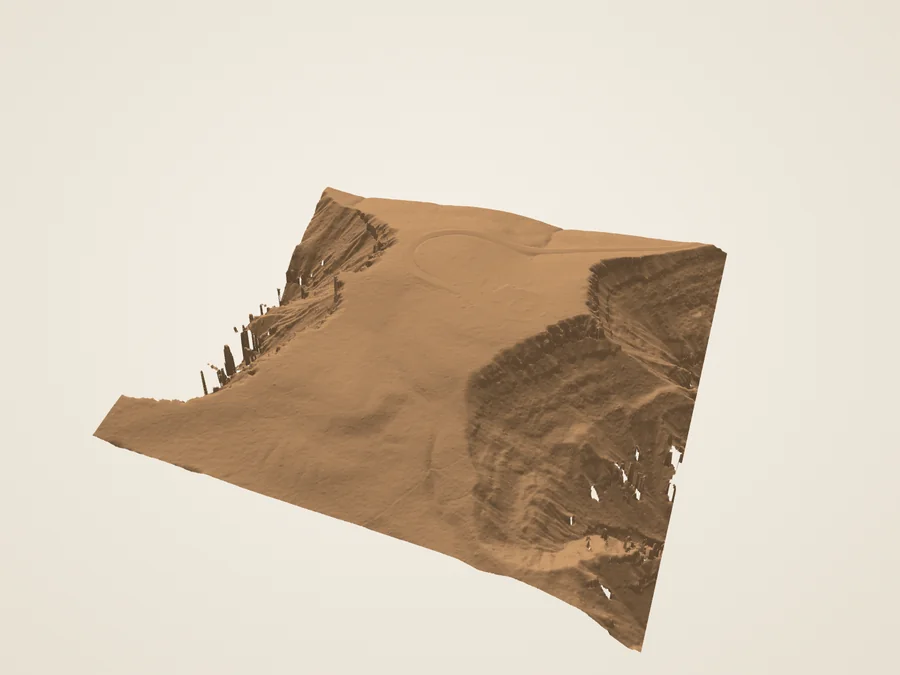
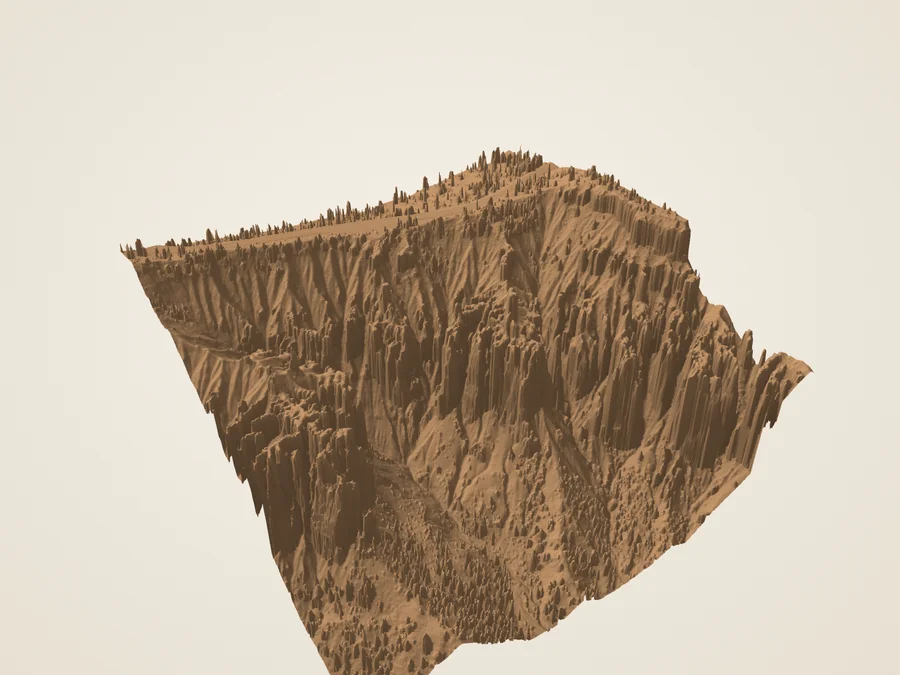
Derived upper surface from 2018 USGS lidar. Hidden rock faces are unresolved. Material and lighting are illustrative.
A slice of the surface
West to east, at true scale
Topographic profile only. Gaps show missing support; no internal strata are drawn.
The illustrated collection
Eight ways to read an edge
Each study has a bounded footprint and an explicit limit. These stills and notes work without interactive graphics.
Derived Rendered terrain study · true vertical scale
01 / Inside the amphitheater
Wall Street
A narrow passage cuts between tall fins of limestone. Seen from above, its enclosed shape is much easier to understand.
Wall Street is one side of the Navajo Loop below Sunset Point. Here the form of the space matters as much as the standing rock: nearby walls can hide the floor from an airborne instrument. Turn the model, then compare it with the laser returns to see what was actually sampled.
The slot floor, overhangs and trunks are incompletely sampled. This is an above-rim study of Wall Street, not a walkable model or a scan of its hidden walls.
Geometry, color & source record
Model extent
320 × 320 metres; vertical exaggeration 1×.
Surface
Derived from measured airborne returns; upper-envelope terrain study, not a closed rock scan
Source coverage
3,699,389 valid returns in this crop, averaging 36.1 returns/m². Density is not an accuracy claim.
Detail grids
2.5 m / 1.25 m / 0.625 m. A smaller cell is an export choice, not new source detail.
Missing support
0.00% of fine-grid nodes omitted; nearest fill limited to 3 m. Hidden undercuts remain unresolved even where the grid has samples.
Photographic color
USDA NAIP aerial RGB, 2024-07-23; 0.6 m source pixels. Overhead color is draped on 2018 terrain. Vertical faces stretch overhead pixels; no ground-level photographic detail is recovered.
Coordinates
UTM 12N in the EPT WGS84 frame; source elevations remain NAVD88 / Geoid12B. Metres; x east, y up, z south.
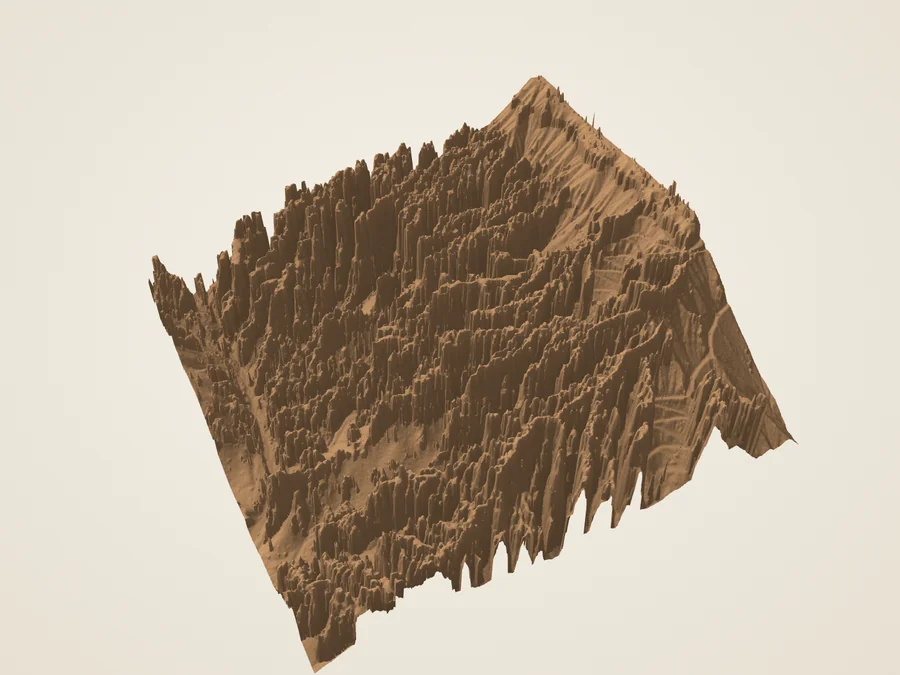
Derived Rendered terrain study · true vertical scale
02 / Inside the amphitheater
Silent City
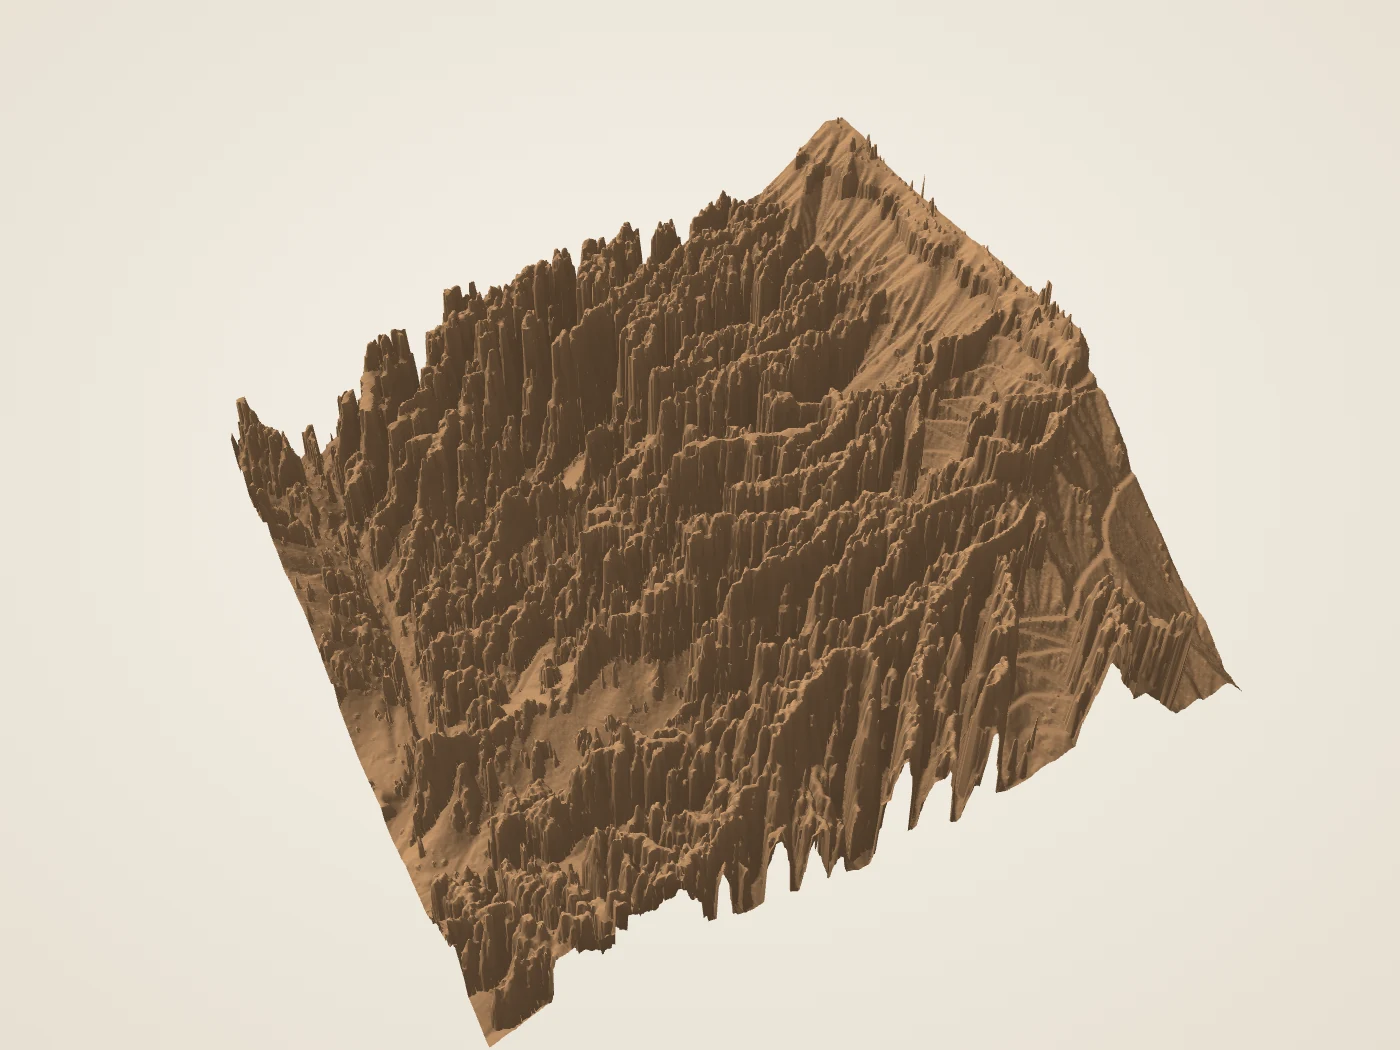
An apparent wall resolves into ranks of fins and spires when the viewpoint changes.
NPS identifies Silent City below the rim south of Sunset Point. Its dense rows are particularly useful for comparing a plan with an oblique view. Move the section across the model and follow the repeated rise and fall of the upper surface.
Silent City is an area, not a single surveyed object. The crop is editorial. Thin spires and gaps can be simplified at lower detail, and an upper envelope cannot show their undercut sides.
Geometry, color & source record
Model extent
512 × 512 metres; vertical exaggeration 1×.
Surface
Derived from measured airborne returns; upper-envelope terrain study, not a closed rock scan
Source coverage
10,321,066 valid returns in this crop, averaging 39.4 returns/m². Density is not an accuracy claim.
Detail grids
4 m / 2 m / 1 m. A smaller cell is an export choice, not new source detail.
Missing support
0.00% of fine-grid nodes omitted; nearest fill limited to 3 m. Hidden undercuts remain unresolved even where the grid has samples.
Photographic color
USDA NAIP aerial RGB, 2024-07-23; 0.6 m source pixels. Overhead color is draped on 2018 terrain. Vertical faces stretch overhead pixels; no ground-level photographic detail is recovered.
Coordinates
UTM 12N in the EPT WGS84 frame; source elevations remain NAVD88 / Geoid12B. Metres; x east, y up, z south.
Derived Rendered terrain study · true vertical scale
03 / Along the rim
Sunset Point sector
The relatively continuous plateau gives way to a much more intricate edge.
Sunset Point overlooks fins, hoodoos and the Navajo descent. This wider crop puts the rim and the beginnings of that descent in one frame. Use a neutral material and move the study light to read the relief without mistaking image shadows for surface shape.
Thor’s Hammer is in this landscape, but its neck is not reconstructed by the upper-envelope surface. The existing individual Thor’s Hammer exhibit explains that separate interpretation.
Geometry, color & source record
Model extent
512 × 512 metres; vertical exaggeration 1×.
Surface
Derived from measured airborne returns; upper-envelope terrain study, not a closed rock scan
Source coverage
8,367,747 valid returns in this crop, averaging 31.9 returns/m². Density is not an accuracy claim.
Detail grids
4 m / 2 m / 1 m. A smaller cell is an export choice, not new source detail.
Missing support
0.00% of fine-grid nodes omitted; nearest fill limited to 3 m. Hidden undercuts remain unresolved even where the grid has samples.
Photographic color
USDA NAIP aerial RGB, 2024-07-23; 0.6 m source pixels. Overhead color is draped on 2018 terrain. Vertical faces stretch overhead pixels; no ground-level photographic detail is recovered.
Coordinates
UTM 12N in the EPT WGS84 frame; source elevations remain NAVD88 / Geoid12B. Metres; x east, y up, z south.
Derived Rendered terrain study · true vertical scale
04 / Along the rim
Inspiration Point sector
A high rim, dissected slopes, and lower ground occupy one compact piece of the plateau edge.
NPS describes Inspiration Point as a set of overlooks into the Bryce Amphitheater. This study concentrates on the nearby rim and slopes. Sweep a west-to-east section from north to south and compare how rapidly the surface drops away at different positions.
The NPS discussion of the Pink and White Members describes the landscape; this model does not map their contacts. Apparent aerial color boundaries are not automatically geologic boundaries.
Geometry, color & source record
Model extent
640 × 640 metres; vertical exaggeration 1×.
Surface
Derived from measured airborne returns; upper-envelope terrain study, not a closed rock scan
Source coverage
13,947,027 valid returns in this crop, averaging 34.0 returns/m². Density is not an accuracy claim.
Detail grids
5 m / 2.5 m / 1.25 m. A smaller cell is an export choice, not new source detail.
Missing support
0.00% of fine-grid nodes omitted; nearest fill limited to 3 m. Hidden undercuts remain unresolved even where the grid has samples.
Photographic color
USDA NAIP aerial RGB, 2024-07-23; 0.6 m source pixels. Overhead color is draped on 2018 terrain. Vertical faces stretch overhead pixels; no ground-level photographic detail is recovered.
Coordinates
UTM 12N in the EPT WGS84 frame; source elevations remain NAVD88 / Geoid12B. Metres; x east, y up, z south.
Derived Rendered terrain study · true vertical scale
05 / Along the rim
Bryce Point sector
The southern rim of the main amphitheater offers a useful lesson in what an overhead survey misses.
Bryce Point looks north over the amphitheater. NPS also describes cavities called the Grottos in the nearby white limestone. Compare surface and returns here to separate the visible upper rim from the unseen spaces beneath it.
The Grottos and Wall of Windows are contextual reading, not completed 3D cave or arch models. This sector does not resolve their interiors or reconstruct windows.
Geometry, color & source record
Model extent
640 × 640 metres; vertical exaggeration 1×.
Surface
Derived from measured airborne returns; upper-envelope terrain study, not a closed rock scan
Source coverage
12,197,003 valid returns in this crop, averaging 29.8 returns/m². Density is not an accuracy claim.
Detail grids
5 m / 2.5 m / 1.25 m. A smaller cell is an export choice, not new source detail.
Missing support
0.00% of fine-grid nodes omitted; nearest fill limited to 3 m. Hidden undercuts remain unresolved even where the grid has samples.
Photographic color
USDA NAIP aerial RGB, 2024-07-23; 0.6 m source pixels. Overhead color is draped on 2018 terrain. Vertical faces stretch overhead pixels; no ground-level photographic detail is recovered.
Coordinates
UTM 12N in the EPT WGS84 frame; source elevations remain NAVD88 / Geoid12B. Metres; x east, y up, z south.
Derived Rendered terrain study · true vertical scale
06 / Beyond the main bowl
Fairyland Point sector
At the northern end of the rim, another set of hollows and ridges breaks up the plateau.
Fairyland Point overlooks Fairyland Canyon north of the main Bryce Amphitheater. NPS describes a landscape with a different erosional history from the main bowl. Here the useful comparison is spatial: trace ridges and hollows without assigning an age or rate to an individual feature.
This is a bounded sector near Fairyland Point, not the entire Fairyland Loop or Boat Mesa. The broader geologic history comes from NPS interpretation and is not dated by the lidar.
Geometry, color & source record
Model extent
768 × 768 metres; vertical exaggeration 1×.
Surface
Derived from measured airborne returns; upper-envelope terrain study, not a closed rock scan
Source coverage
18,386,528 valid returns in this crop, averaging 31.2 returns/m². Density is not an accuracy claim.
Detail grids
6 m / 3 m / 1.5 m. A smaller cell is an export choice, not new source detail.
Missing support
0.00% of fine-grid nodes omitted; nearest fill limited to 3 m. Hidden undercuts remain unresolved even where the grid has samples.
Photographic color
USDA NAIP aerial RGB, 2024-07-23; 0.6 m source pixels. Overhead color is draped on 2018 terrain. Vertical faces stretch overhead pixels; no ground-level photographic detail is recovered.
Coordinates
UTM 12N in the EPT WGS84 frame; source elevations remain NAVD88 / Geoid12B. Metres; x east, y up, z south.
Derived Rendered terrain study · true vertical scale
07 / Beyond the main bowl
Rainbow & Yovimpa
Two overlooks face different directions from the same high southern rim.
NPS identifies Rainbow and Yovimpa as the park’s highest viewpoints. Rainbow looks north along the plateau edge; Yovimpa looks south toward the Grand Staircase. This paired exhibit studies only their nearby topography, keeping the shared ridge and its opposite slopes at one scale.
This exhibit uses only the survey’s ground class to avoid modeling the forest as rock. That class can omit standing formations; undercut cliffs and distant Grand Staircase steps are not reconstructed. Compare the full return sample to see what was excluded.
Geometry, color & source record
Model extent
768 × 768 metres; vertical exaggeration 1×.
Surface
Derived from source-classified ground returns; terrain study, not a closed rock scan
Source coverage
21,492,471 valid returns in this crop, averaging 36.4 returns/m². Density is not an accuracy claim.
Detail grids
6 m / 3 m / 1.5 m. A smaller cell is an export choice, not new source detail.
Missing support
0.76% of fine-grid nodes omitted; nearest fill limited to 3 m. Hidden undercuts remain unresolved even where the grid has samples.
Photographic color
USDA NAIP aerial RGB, 2024-07-23; 0.6 m source pixels. Overhead color is draped on 2018 terrain. Vertical faces stretch overhead pixels; no ground-level photographic detail is recovered.
Coordinates
UTM 12N in the EPT WGS84 frame; source elevations remain NAVD88 / Geoid12B. Metres; x east, y up, z south.
Derived Rendered terrain study · true vertical scale
08 / Beyond the main bowl
Agua Canyon sector
Standing formations interrupt the steep edge of the southern plateau.
NPS identifies Agua Canyon as a viewpoint with prominent hoodoos known as the Hunter and Rabbit. This crop studies the surrounding terrain and the separation of standing rock from slopes. The individual named formations require closer surface evidence before a complete sculptural reconstruction can be accepted.
The sector is complete as a terrain study only. It does not certify a complete mesh of either named hoodoo or resolve their hidden faces.
Geometry, color & source record
Model extent
512 × 512 metres; vertical exaggeration 1×.
Surface
Derived from measured airborne returns; upper-envelope terrain study, not a closed rock scan
Source coverage
8,243,121 valid returns in this crop, averaging 31.4 returns/m². Density is not an accuracy claim.
Detail grids
4 m / 2 m / 1 m. A smaller cell is an export choice, not new source detail.
Missing support
0.00% of fine-grid nodes omitted; nearest fill limited to 3 m. Hidden undercuts remain unresolved even where the grid has samples.
Photographic color
USDA NAIP aerial RGB, 2024-07-23; 0.6 m source pixels. Overhead color is draped on 2018 terrain. Vertical faces stretch overhead pixels; no ground-level photographic detail is recovered.
Coordinates
UTM 12N in the EPT WGS84 frame; source elevations remain NAVD88 / Geoid12B. Metres; x east, y up, z south.
Explore Boat Mesa, Sinking Ship and China Wall in the north, then follow the plateau toward Hat Shop, Swamp Canyon and the southern overlooks. These are terrain studies with explicit source gaps, not complete ground scans.
Evidence before detail
What the surface can tell us
The 2018 USGS airborne lidar records points on surfaces seen from the aircraft. We remove likely vegetation, take the highest retained return near each grid node, and fill small gaps from the nearest sample, up to 3 m away. Larger unsupported areas stay open. Seven studies use this upper envelope; the forested Rainbow/Yovimpa exhibit uses the source survey’s ground class instead. Ground classification can omit standing rock, so its full return sample is also available. Neither surface is a watertight scan.
The three detail levels change mesh sampling, not the source survey. Sides beneath overhangs, windows, caves and some slot floors remain unknown. Neither a filled grid nor a photograph from one angle establishes those hidden shapes.
Color is a separate layer
The aerial layer uses USDA NAIP RGB photography from 2024, locked to the source images named in each record. It is projected straight down onto a surface derived from 2018 returns. Trees, shadows, differing dates and metre-scale alignment limits remain. Aerial color stretches on steep walls; it does not recover ground-level photographic detail.
Relief material, study lighting, coverage colors and return categories are illustrations. Coverage shows direct grid support, short nearest-sample filling and omitted data—not a confidence score for hidden walls.
These are historical educational studies, not live views, route guidance or forecasts of erosion or collapse. Independent geology, field, assistive-technology and physical-device reviews remain separate.
Already in the atlas
Three closer studies
The existing Thor’s Hammer, Natural Bridge and Queen’s Garden exhibits retain their own methods and limitations. Their reconstructed undercuts and opening outlines are not silently folded into this collection’s measured terrain.
Primary reading & data credits
USGS 3DEP LiDAR Point Clouds — USGS data; public Entwine organization maintained by Hobu. Lossless public EPT copy, independent measured returns, public-domain data rights. Only the anonymous usgs-lidar-public bucket was used; no requester-pays bucket. Checked 2026-10-02.
Native LAS source metadata retained in the UT Southern QL1 EPT — USGS LAS metadata via public Entwine copy. Native compound WKT specifies NAD83(2011) / UTM 12N and NAVD88 height, Geoid12B. The EPT itself declares EPSG:3857. Elevation is retained without a vertical conversion. Native metadata groups 1700 and 1800 cover all 15 original LAS tile IDs in these crops; both groups were checked in evidence/source-coordinate-check.json. Checked 2026-10-02.
USGS Lidar Point Cloud UT Southern QL1 2018 12SUG9562 LAS 2019 metadata — US Geological Survey. Project acquisition interval 2018-04-27 to 2018-07-29, publication date, source limitations. The generic XML horizontal reference is malformed (UTM zone 30); native LAS WKT and EPT metadata control coordinate interpretation instead. Checked 2026-10-02.
USDA conterminous US NAIP imagery service — USDA FPAC / Farm Service Agency. Locked primary-raster RGB crops, image identities and acquisition dates. Per-model imagery.json retains exact requests, extents and hashes. Checked 2026-10-02.
National Agriculture Imagery Program (NAIP) Imagery — US Department of Agriculture, data.gov catalog. Dataset-specific rights, aerial acquisition and orthorectification. This does not grant rights to Utah Hexagon or Google licensed imagery, neither of which is used. Checked 2026-10-02.
National Agriculture Imagery Program (NAIP) — Utah Geospatial Resource Center. Utah 2018-and-later NAIP is 0.6 m imagery with a stated horizontal accuracy of +/-4 m; source service and flight-date fields. Sampling a mesh more finely does not improve image resolution. Checked 2026-10-02.
Navajo Loop Trail — National Park Service. Wall Street and Two Bridges are the two sides of Navajo Loop; narrow limestone walls and Douglas-fir context. No current trail status is asserted. Checked 2026-10-02.
Sunset Point — National Park Service. Sunset sector, Thor’s Hammer below the viewpoint, Silent City to the south, Claron color interpretation. Checked 2026-10-02.
Inspiration Point — National Park Service. Multiple rim overlooks; Silent City rows south of Sunset; nearby upper White and lower Pink Member context. No member contacts are mapped by this model. Checked 2026-10-02.
Bryce Point — National Park Service. Southern viewpoint looking north; Grottos and Wall of Windows context; hidden interiors not resolved by airborne topography. Checked 2026-10-02.
Fairyland Point — National Park Service. Northern viewpoint, Fairyland Canyon and neighboring Boat Mesa/Campbell Canyon; differing erosional history, without numeric age or rate. Checked 2026-10-02.
Rainbow Point — National Park Service. One of the highest viewpoints, northward view, undercut southern plateau cliffs; local crop does not show the entire distant view. Checked 2026-10-02.
Yovimpa Point — National Park Service. High southern overlook facing the Grand Staircase; paired exhibit studies its local ridge only. Checked 2026-10-02.
Agua Canyon — National Park Service. Agua Canyon identity and prominent Hunter/Rabbit hoodoos; individual hidden surfaces remain unresolved. Checked 2026-10-02.
Twenty-three places from Mossy Cave to Riggs Spring, each with its photograph, terrain, canyon section, early photographs, best light, walks and sources.

 Derived Rendered terrain study · true vertical scale